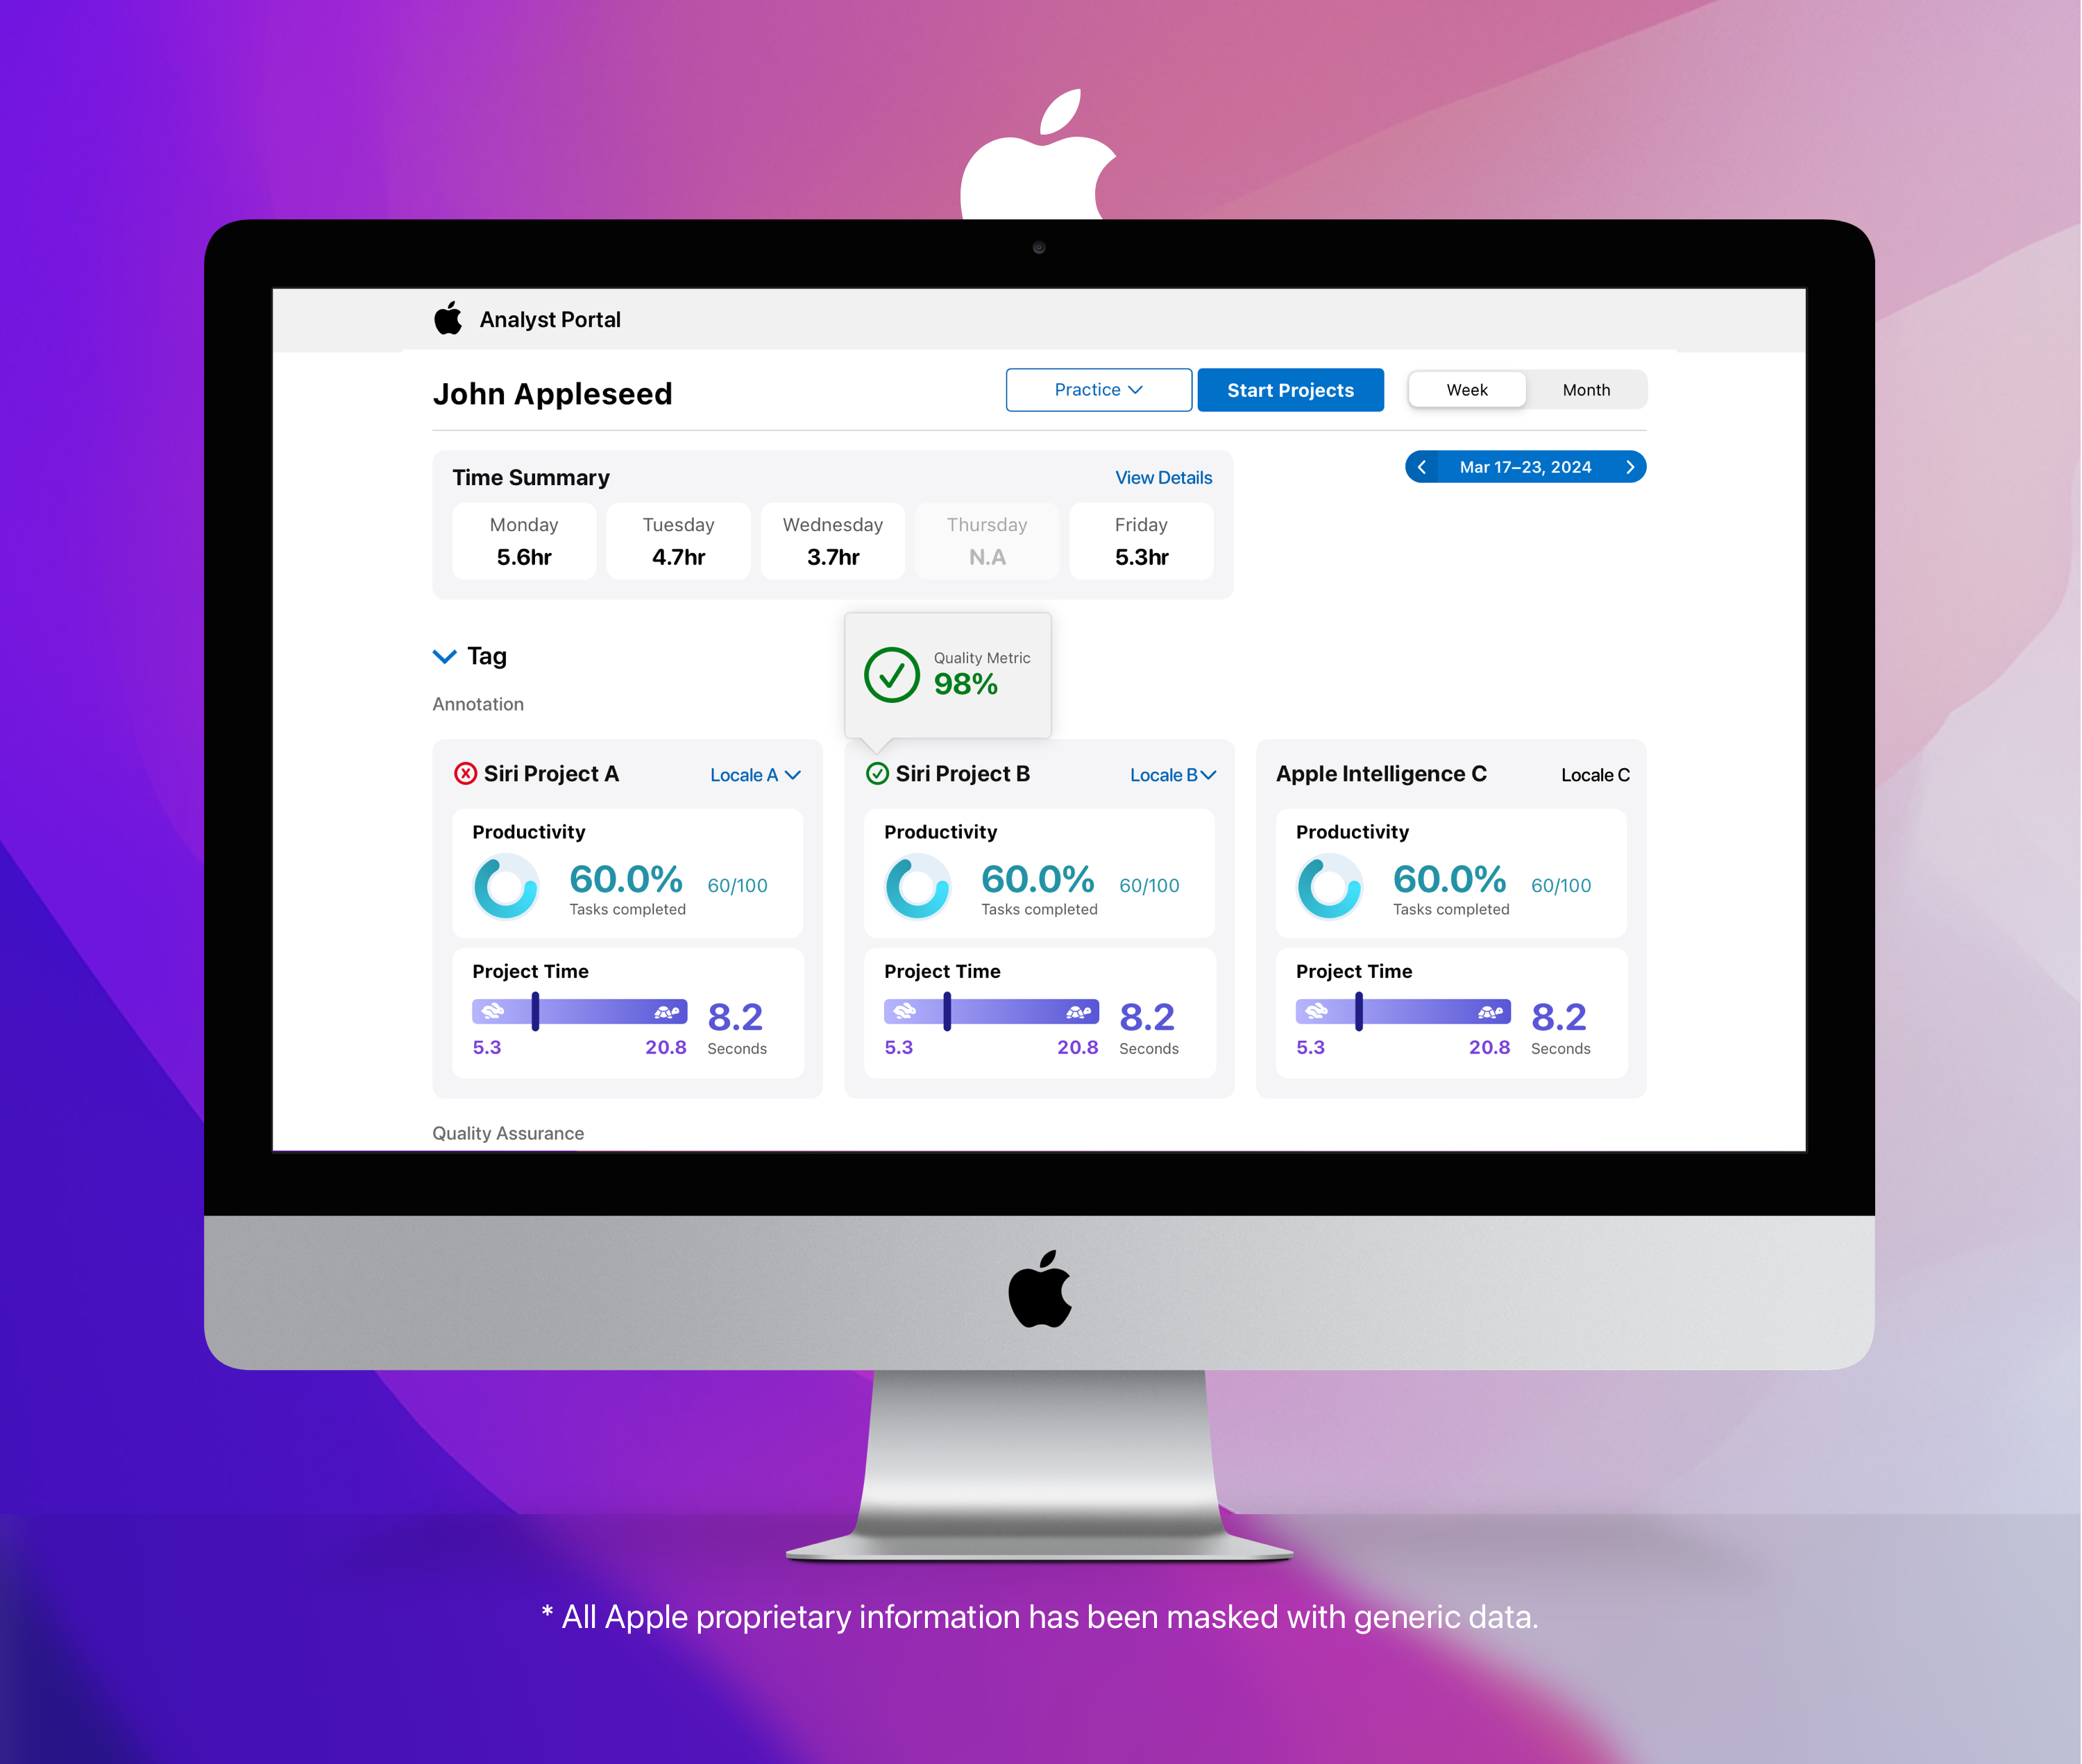
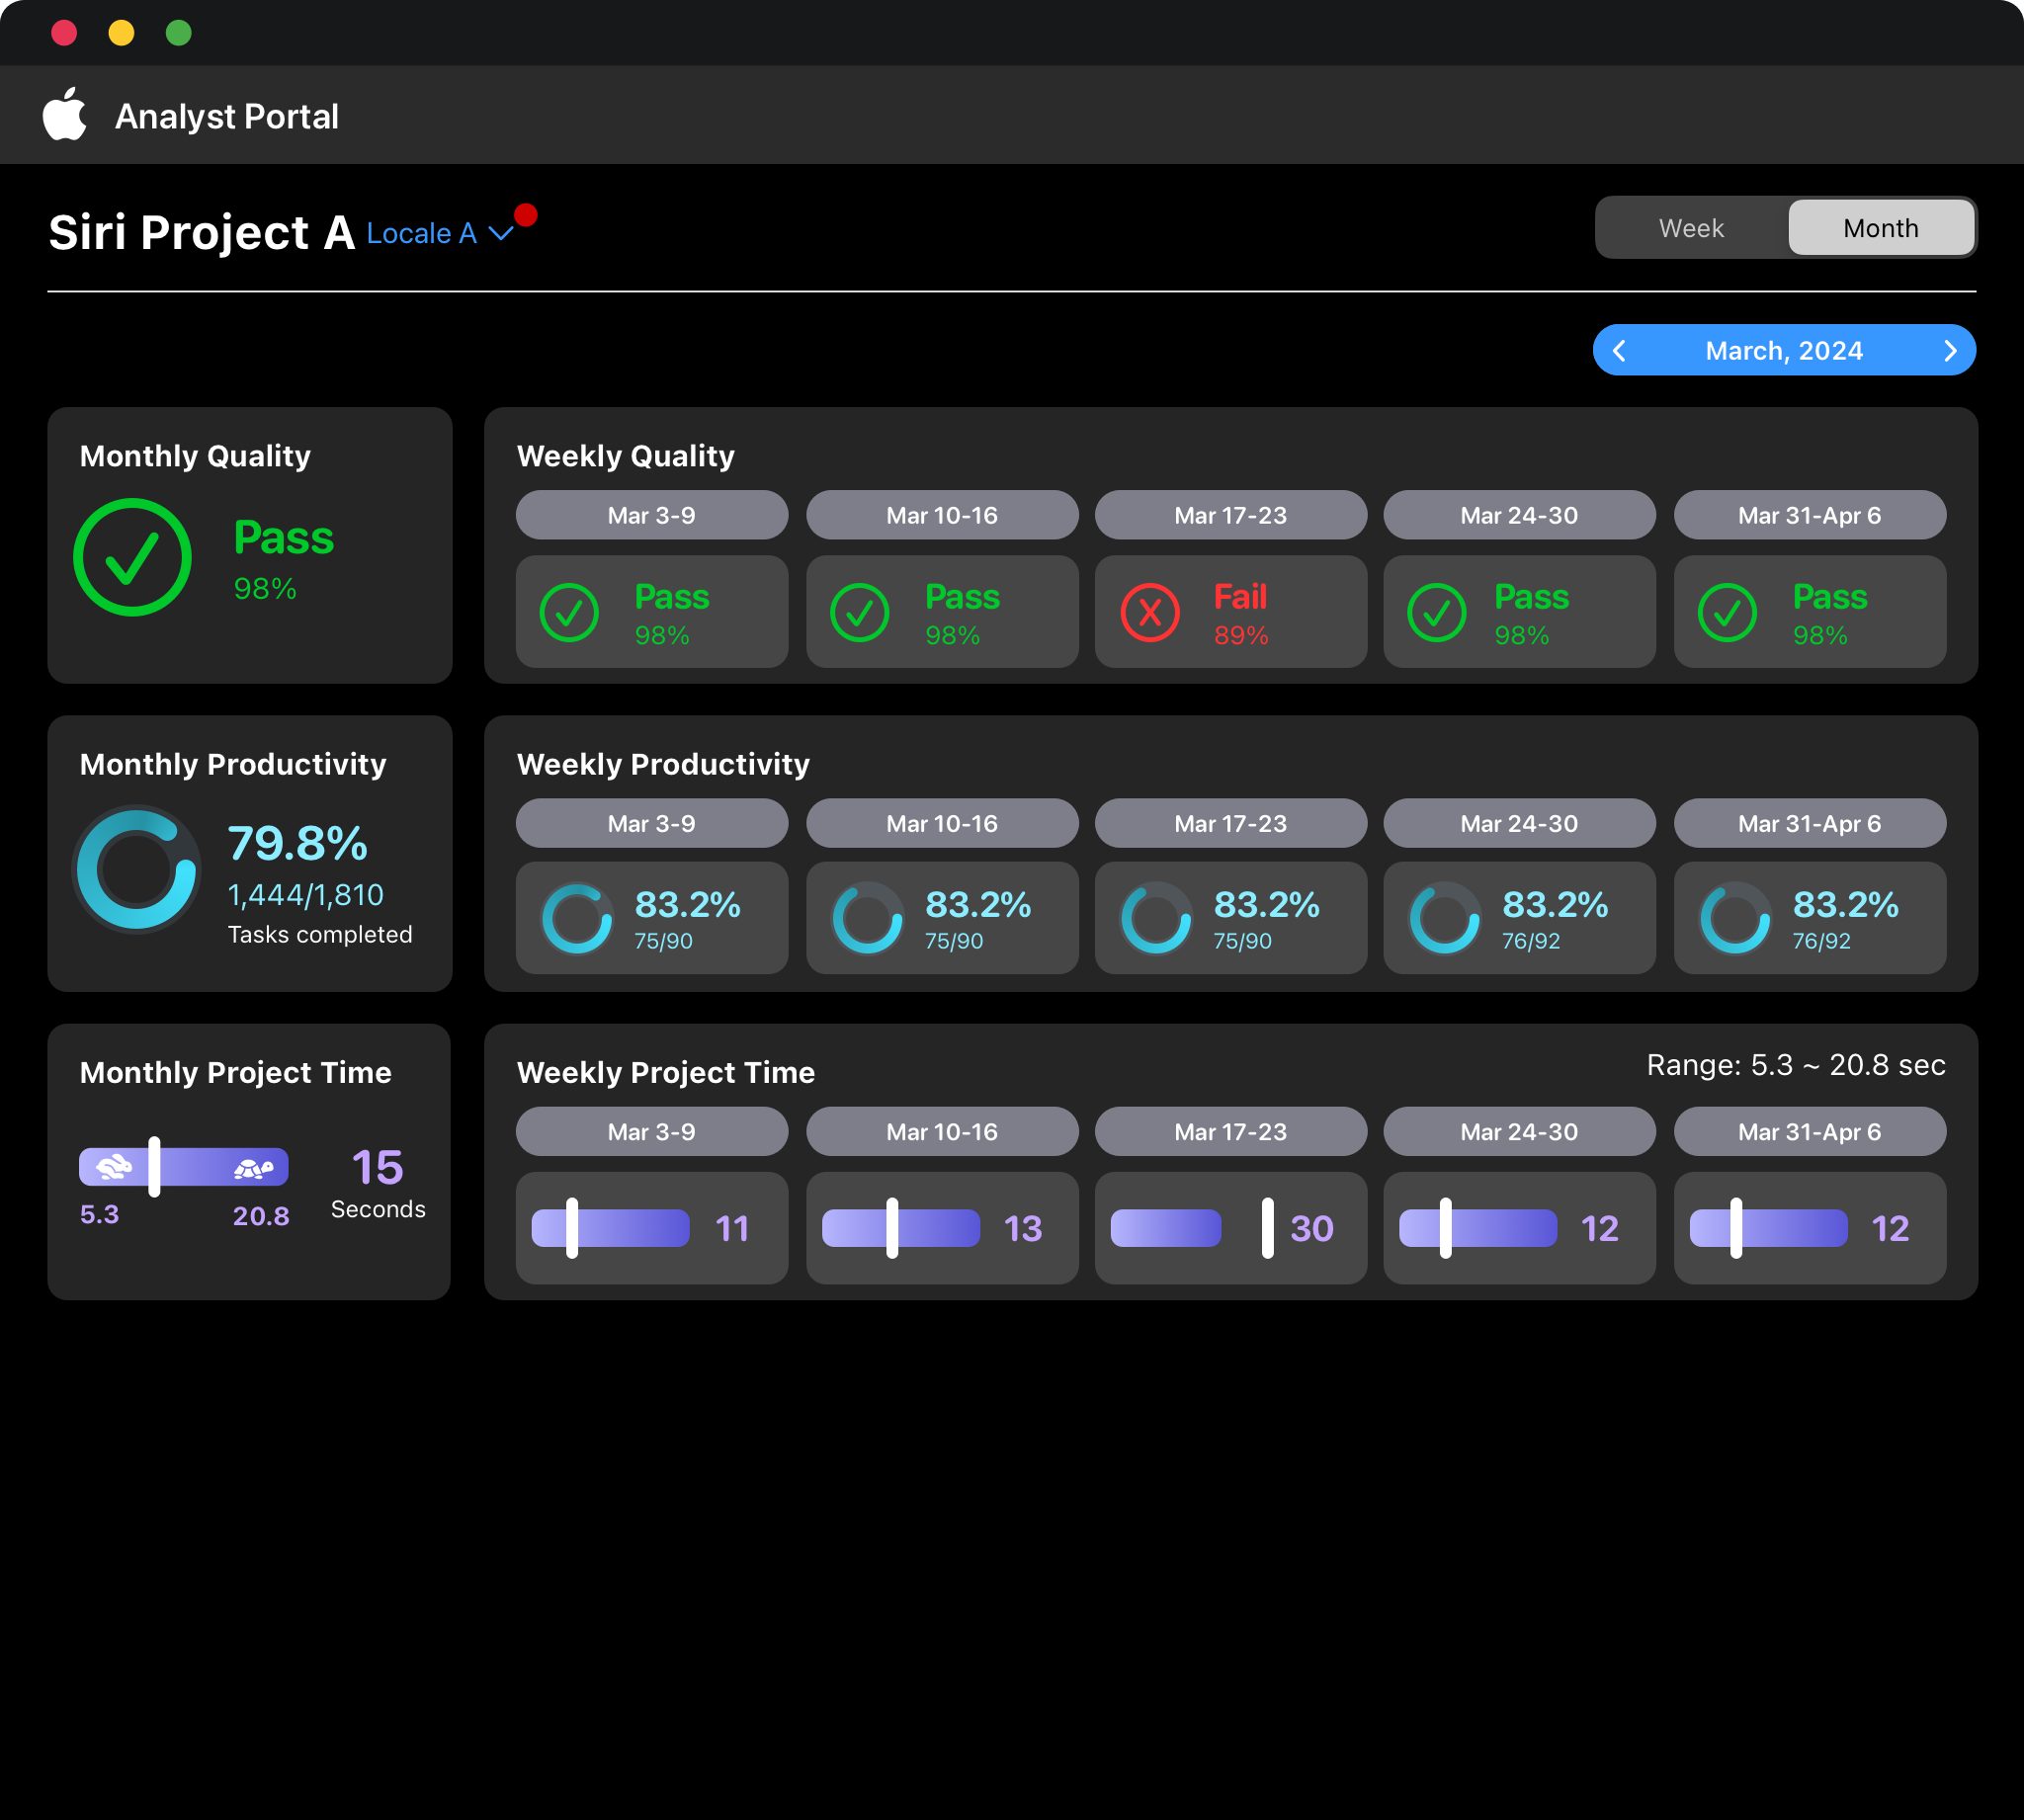
The one-stop dashboard for AI Analyst performance across annotation and data tools, designed and built through an AI accelerated workflow.
Product DesignDashboardAI Evaluation
Challenge
Analysts in Apple’s AIML Data Operations org worldwide struggled to understand their own performance, leading to arbitrary reviews and inconsistent management styles prone to bias.
Team Leads couldn’t make informed decisions about promotions and bonuses, and weren’t taken seriously by their direct reports.
Analysts were anxious about their performance and didn’t know how to improve for career growth.
Analysts could easily game the system and get away with underperforming, killing any motivation to excel.
Users
Primary User: Analyst
Reviews the metrics on Analyst Portal to determine their performance.
Am I on track to the goals given to me?
How am I doing among my peers?
What tradeoffs improve my performance, like speed versus accuracy?
Where are my strongest and weakest projects, so I know where to focus training?
Secondary User: Team Lead
Tracks Analyst performance to determine rewards and bonuses.
Tracks Productivity through an Analyst's task volume and time spent grading.
Tracks quality via a dedicated quality score.
Compares Analysts against their peers to gauge relative performance.
Benchmarks Analysts against quantifiable goals.
Product Team & My Role
Lead UX Designer & EPM: an unusual dual role that let me own design and product end-to-end, driving requirements, prioritization, and stakeholder buy-in directly across three functions, Data Operations leadership, Data Science, and a full Engineering team, with no translation layer in between.
UX Designer & Product Manager
Owned the product spec, UI, and branding, plus the roadmap, feature requirements, cross-team alignment, and engineering prioritization.
Data Operations Leadership
Managers and team leads who defined performance management needs and identified gaps in performance tracking.
Data Scientists
Built the algorithm behind performance data calculations.
Development Team
Frontend and backend engineers who built the UI and connected the data pipelines behind it.
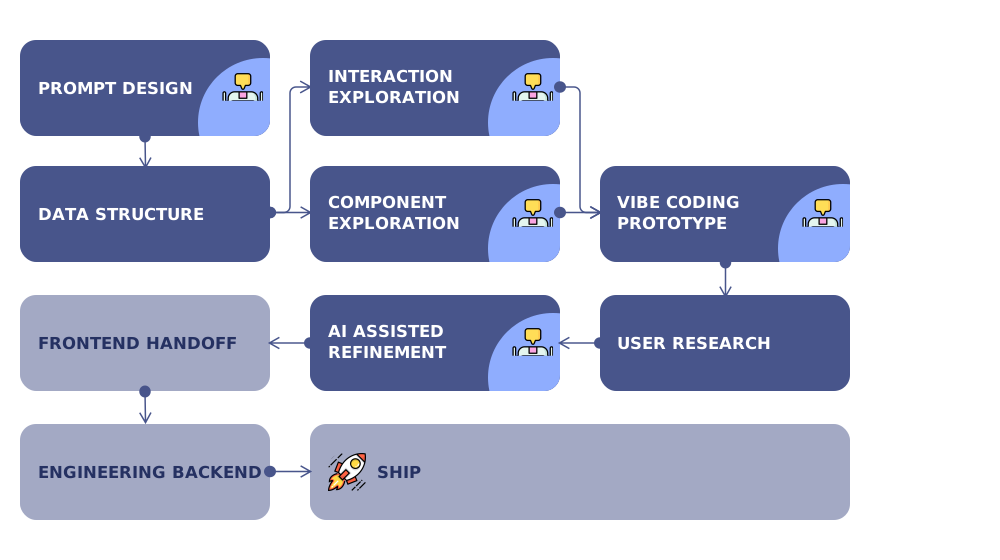
AI Integrated Design Process
Fast iterative process using image generation and vibe coding to produce html prototypes and design concepts efficiently.
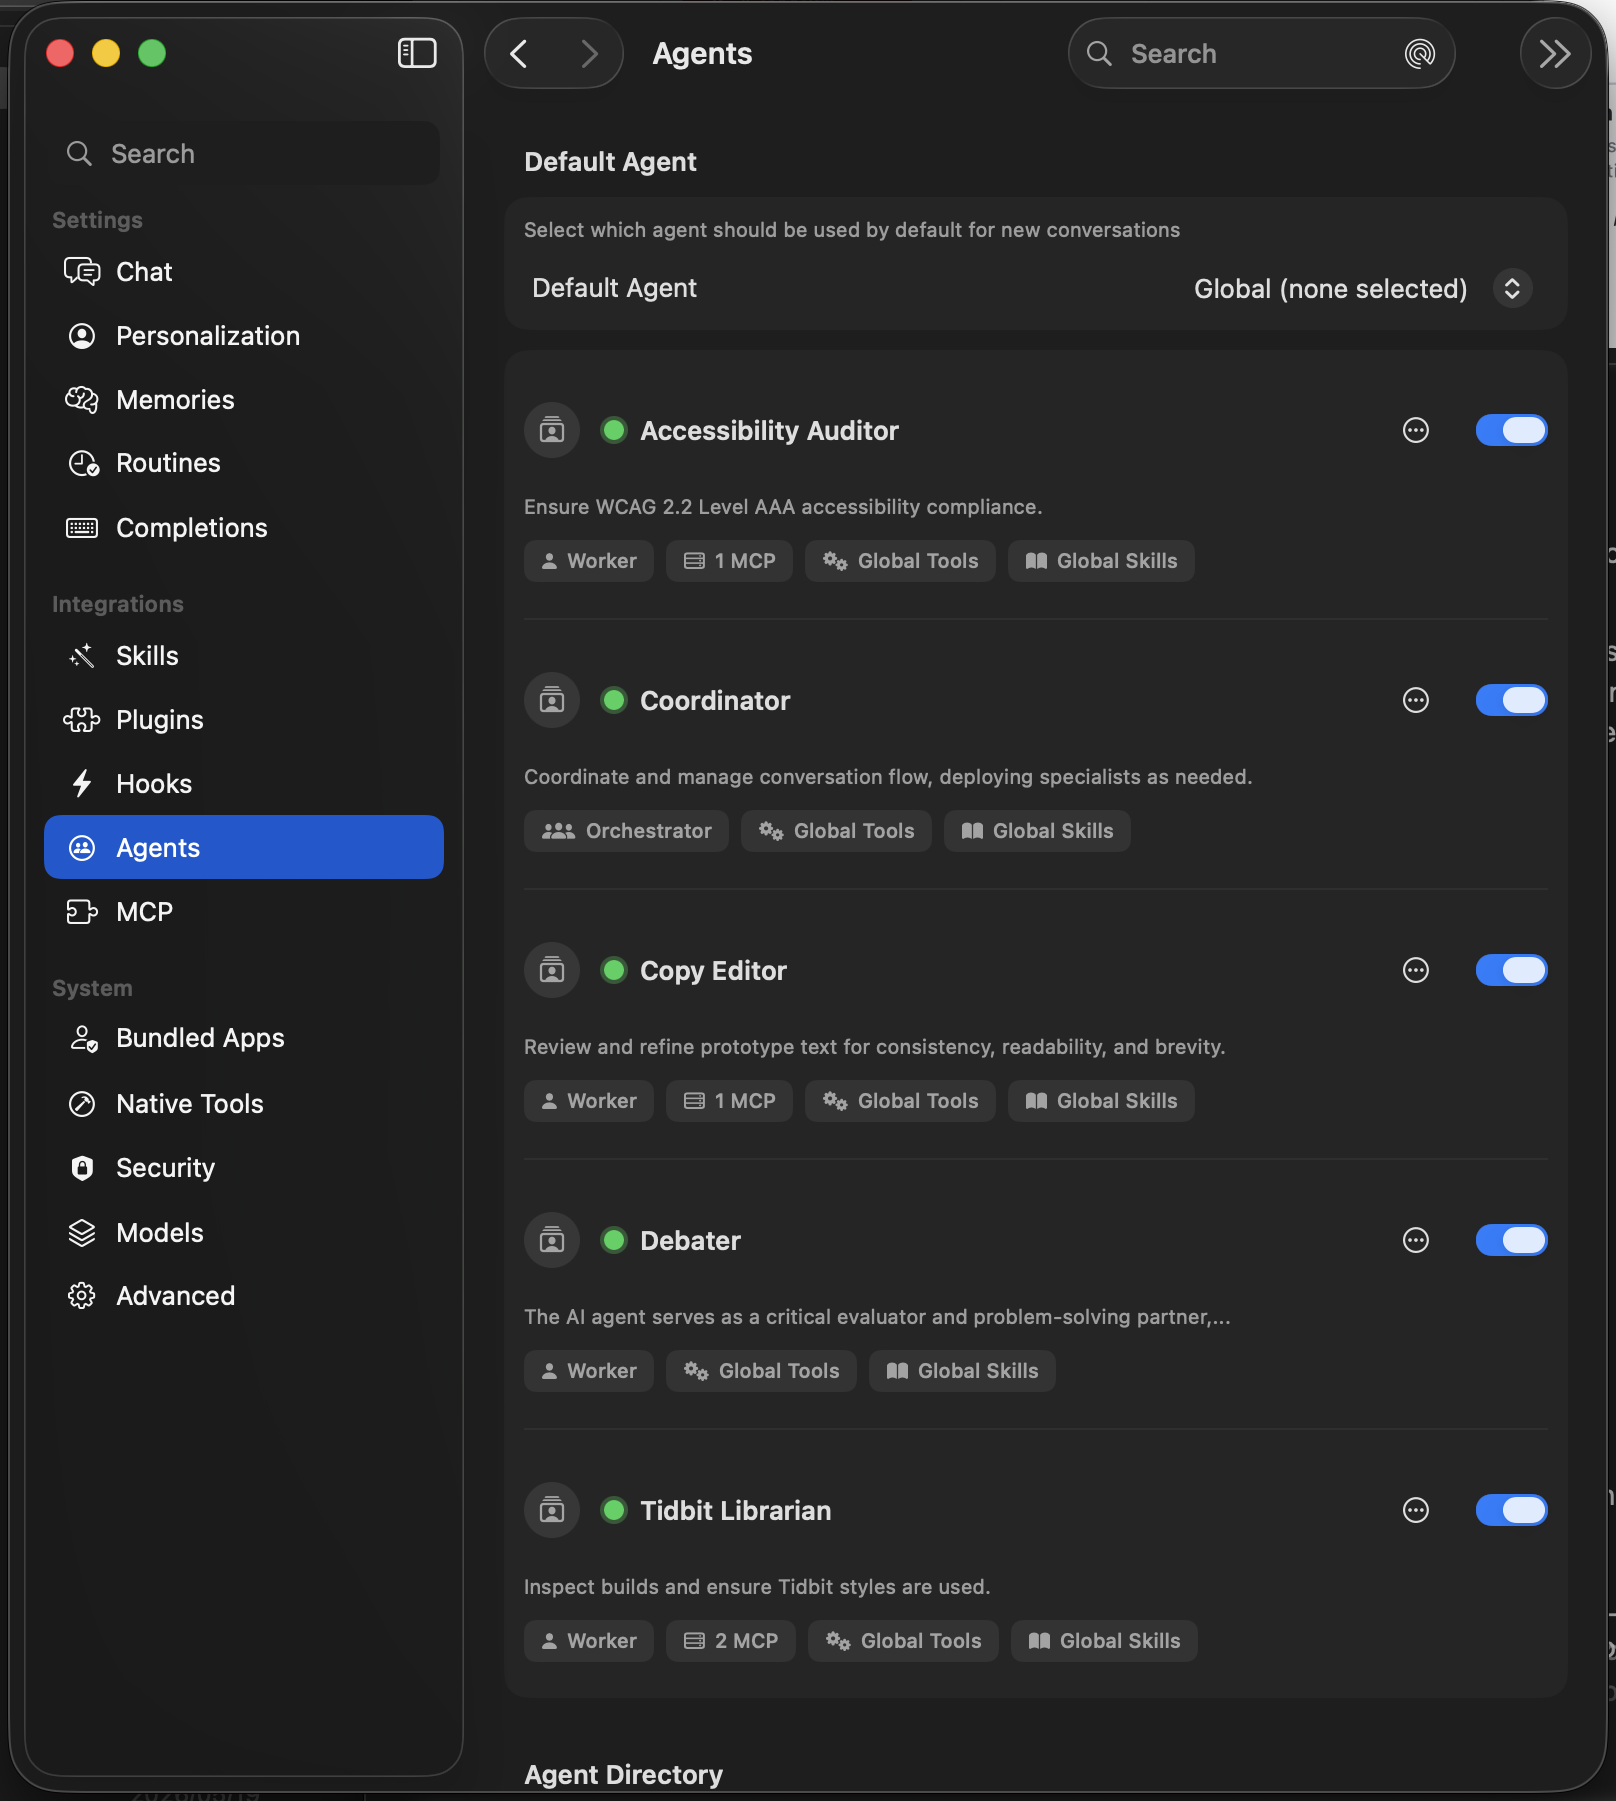
AI Agent Collaboration
Skills
Reusable copy editor and accessibility auditor with their own markdown rulebook for all my designs.
Debate
Multiple agents argued competing directions against each other for better outcome each round.
MCP
Wired in Tidbit, Apple's design system, so the output used real components.
Design and Product Decisions
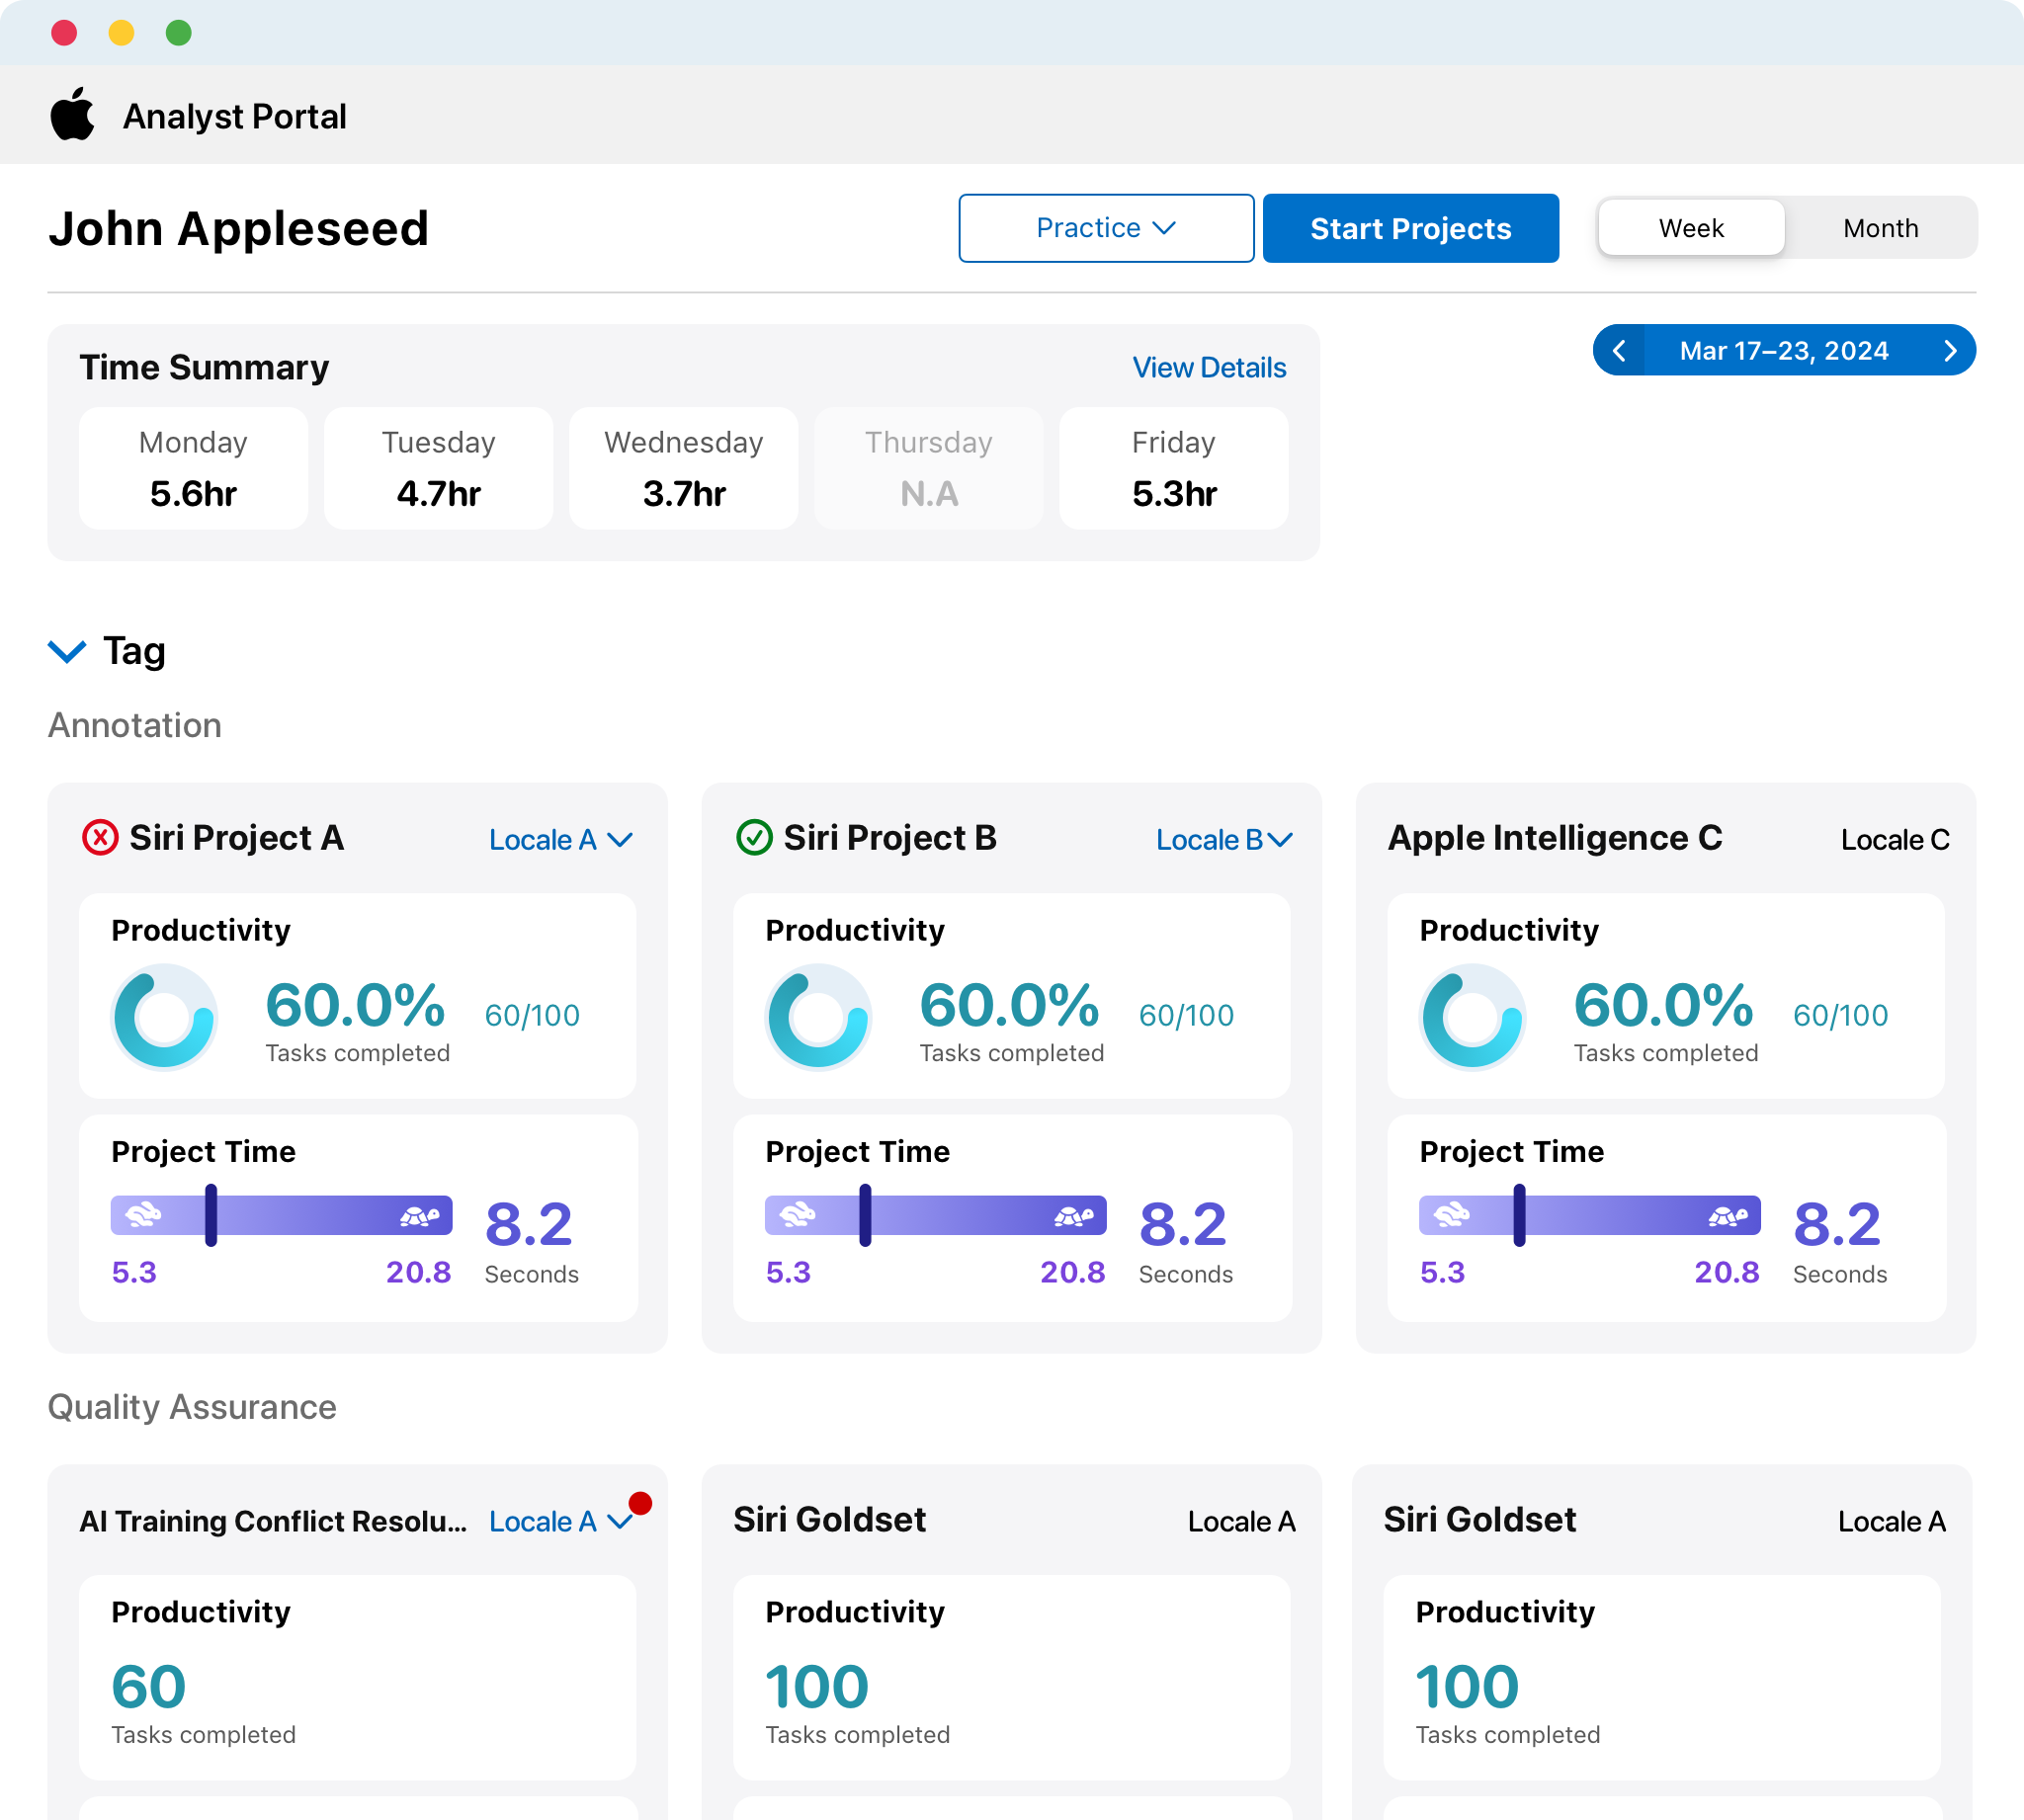
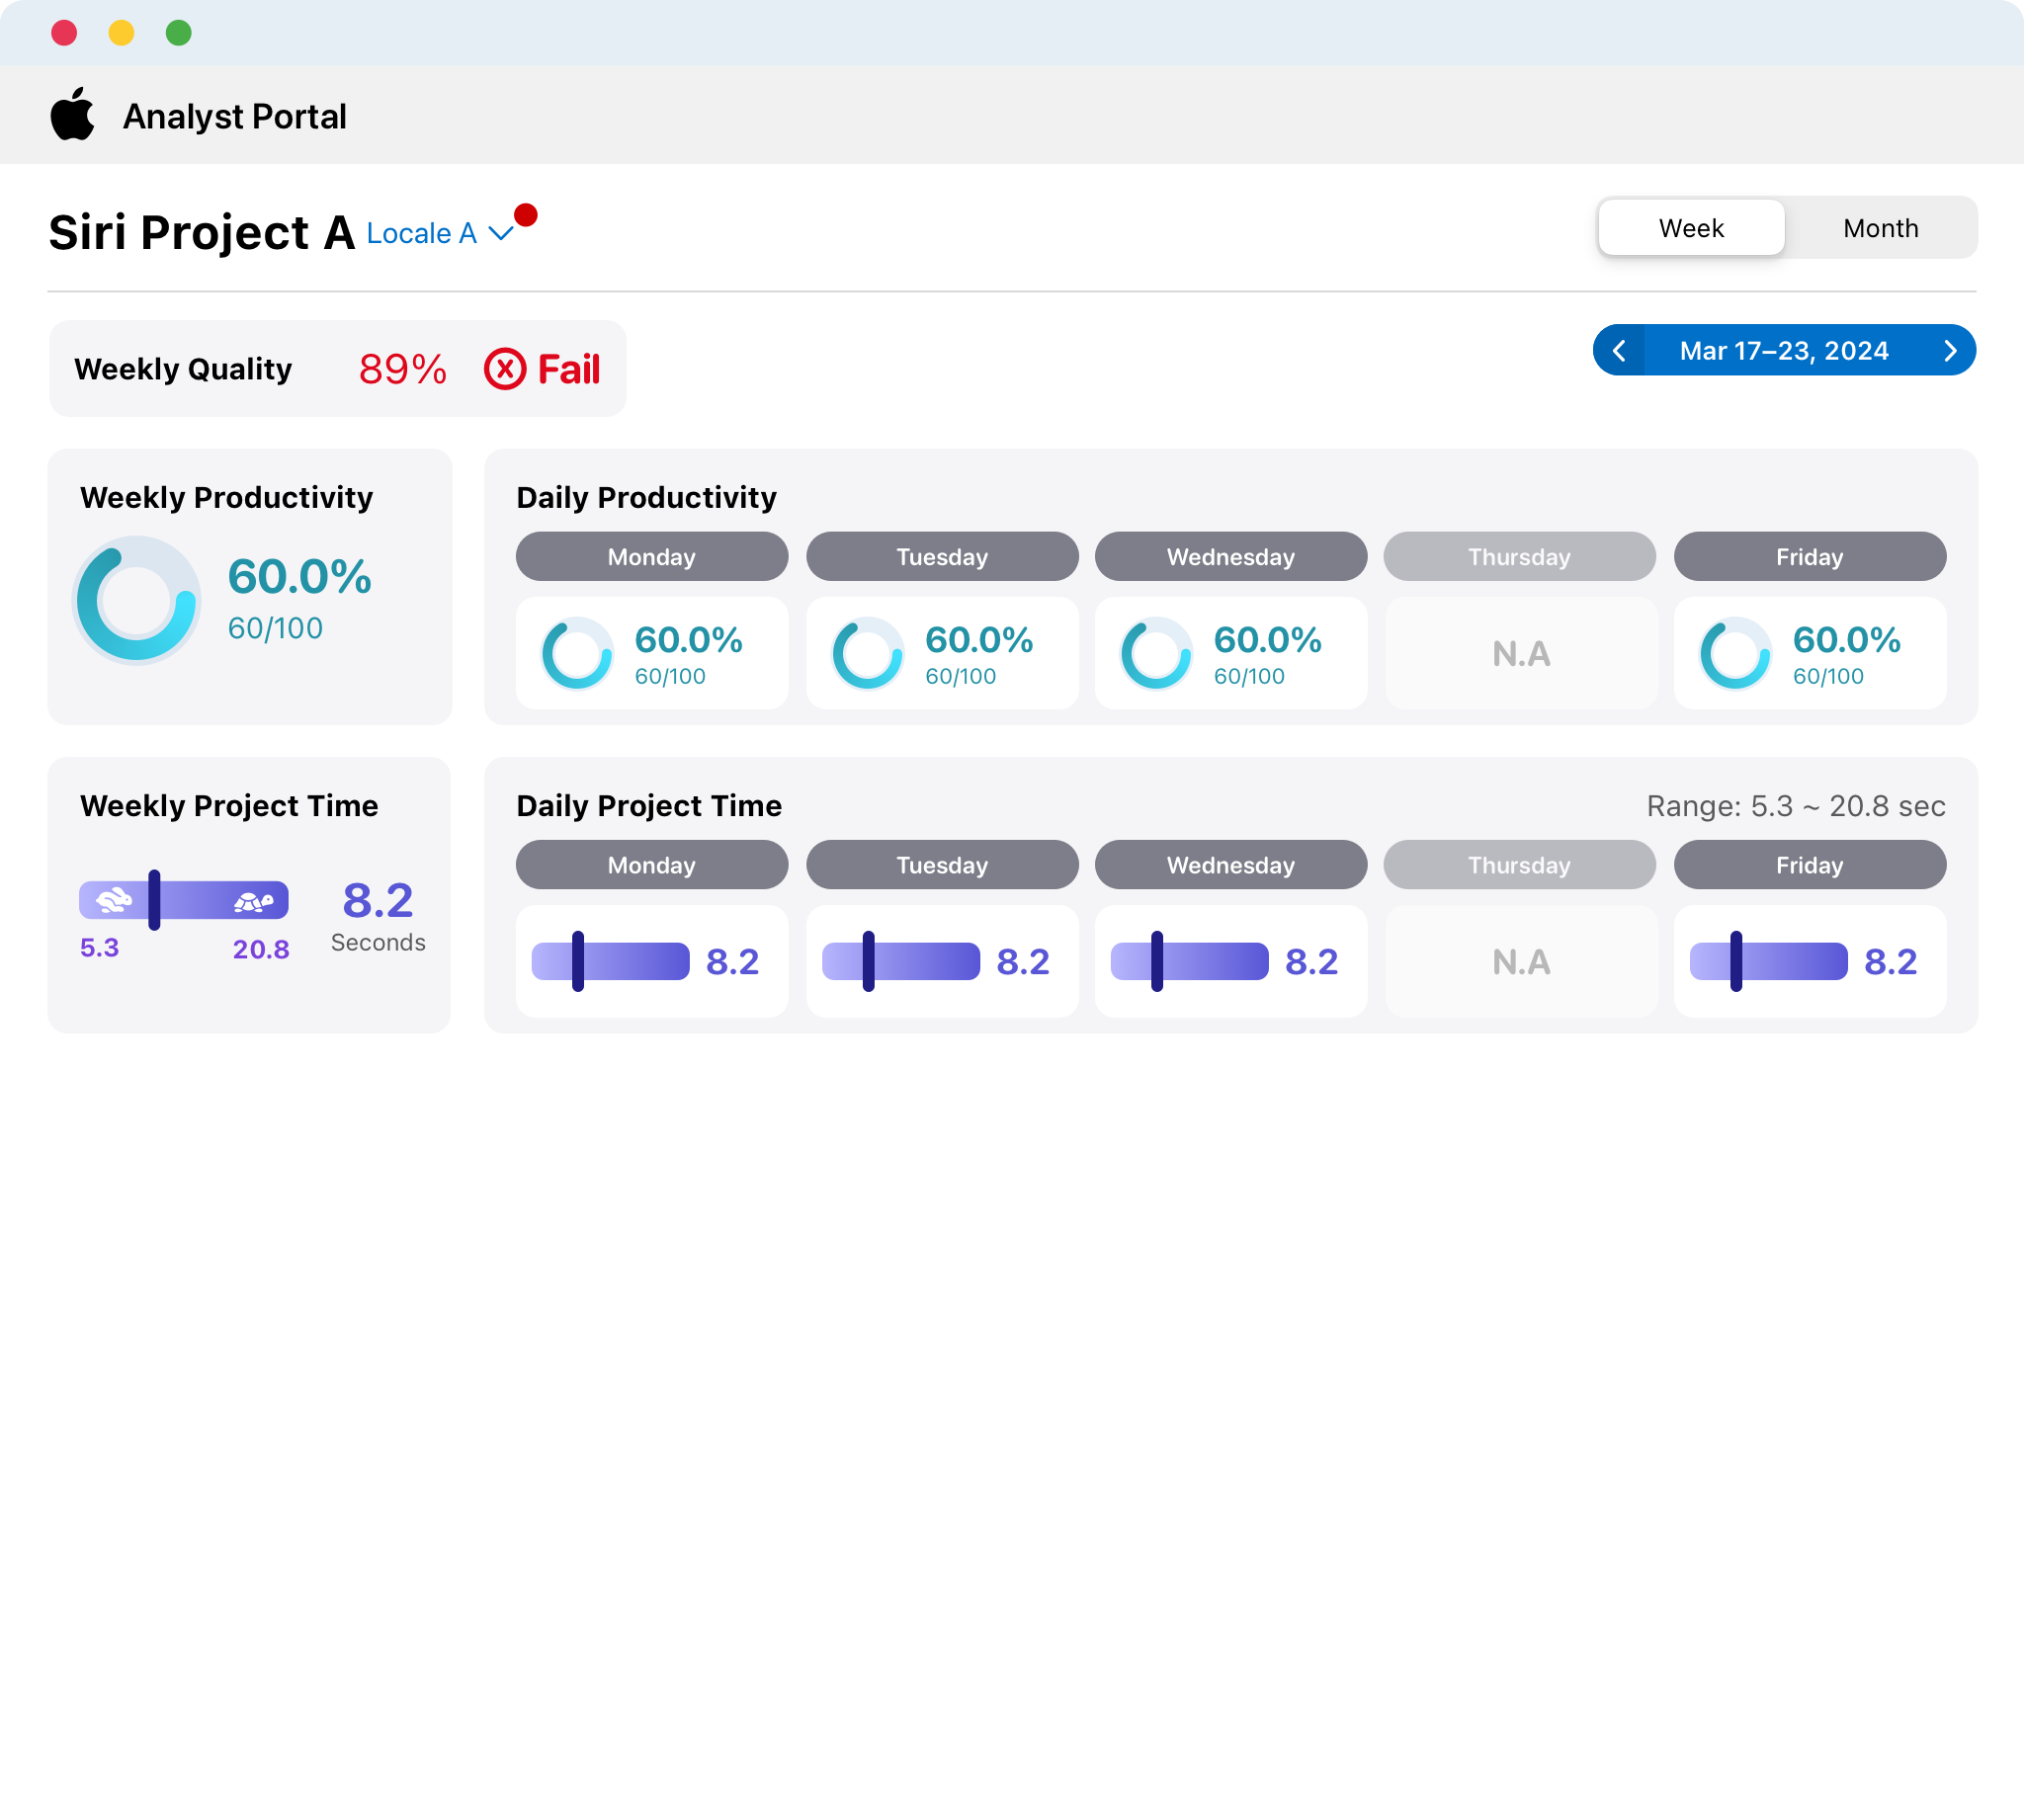
Gave Quality and Productivity equal visual weight, moving the team off a single accuracy score that was skewing incentives.
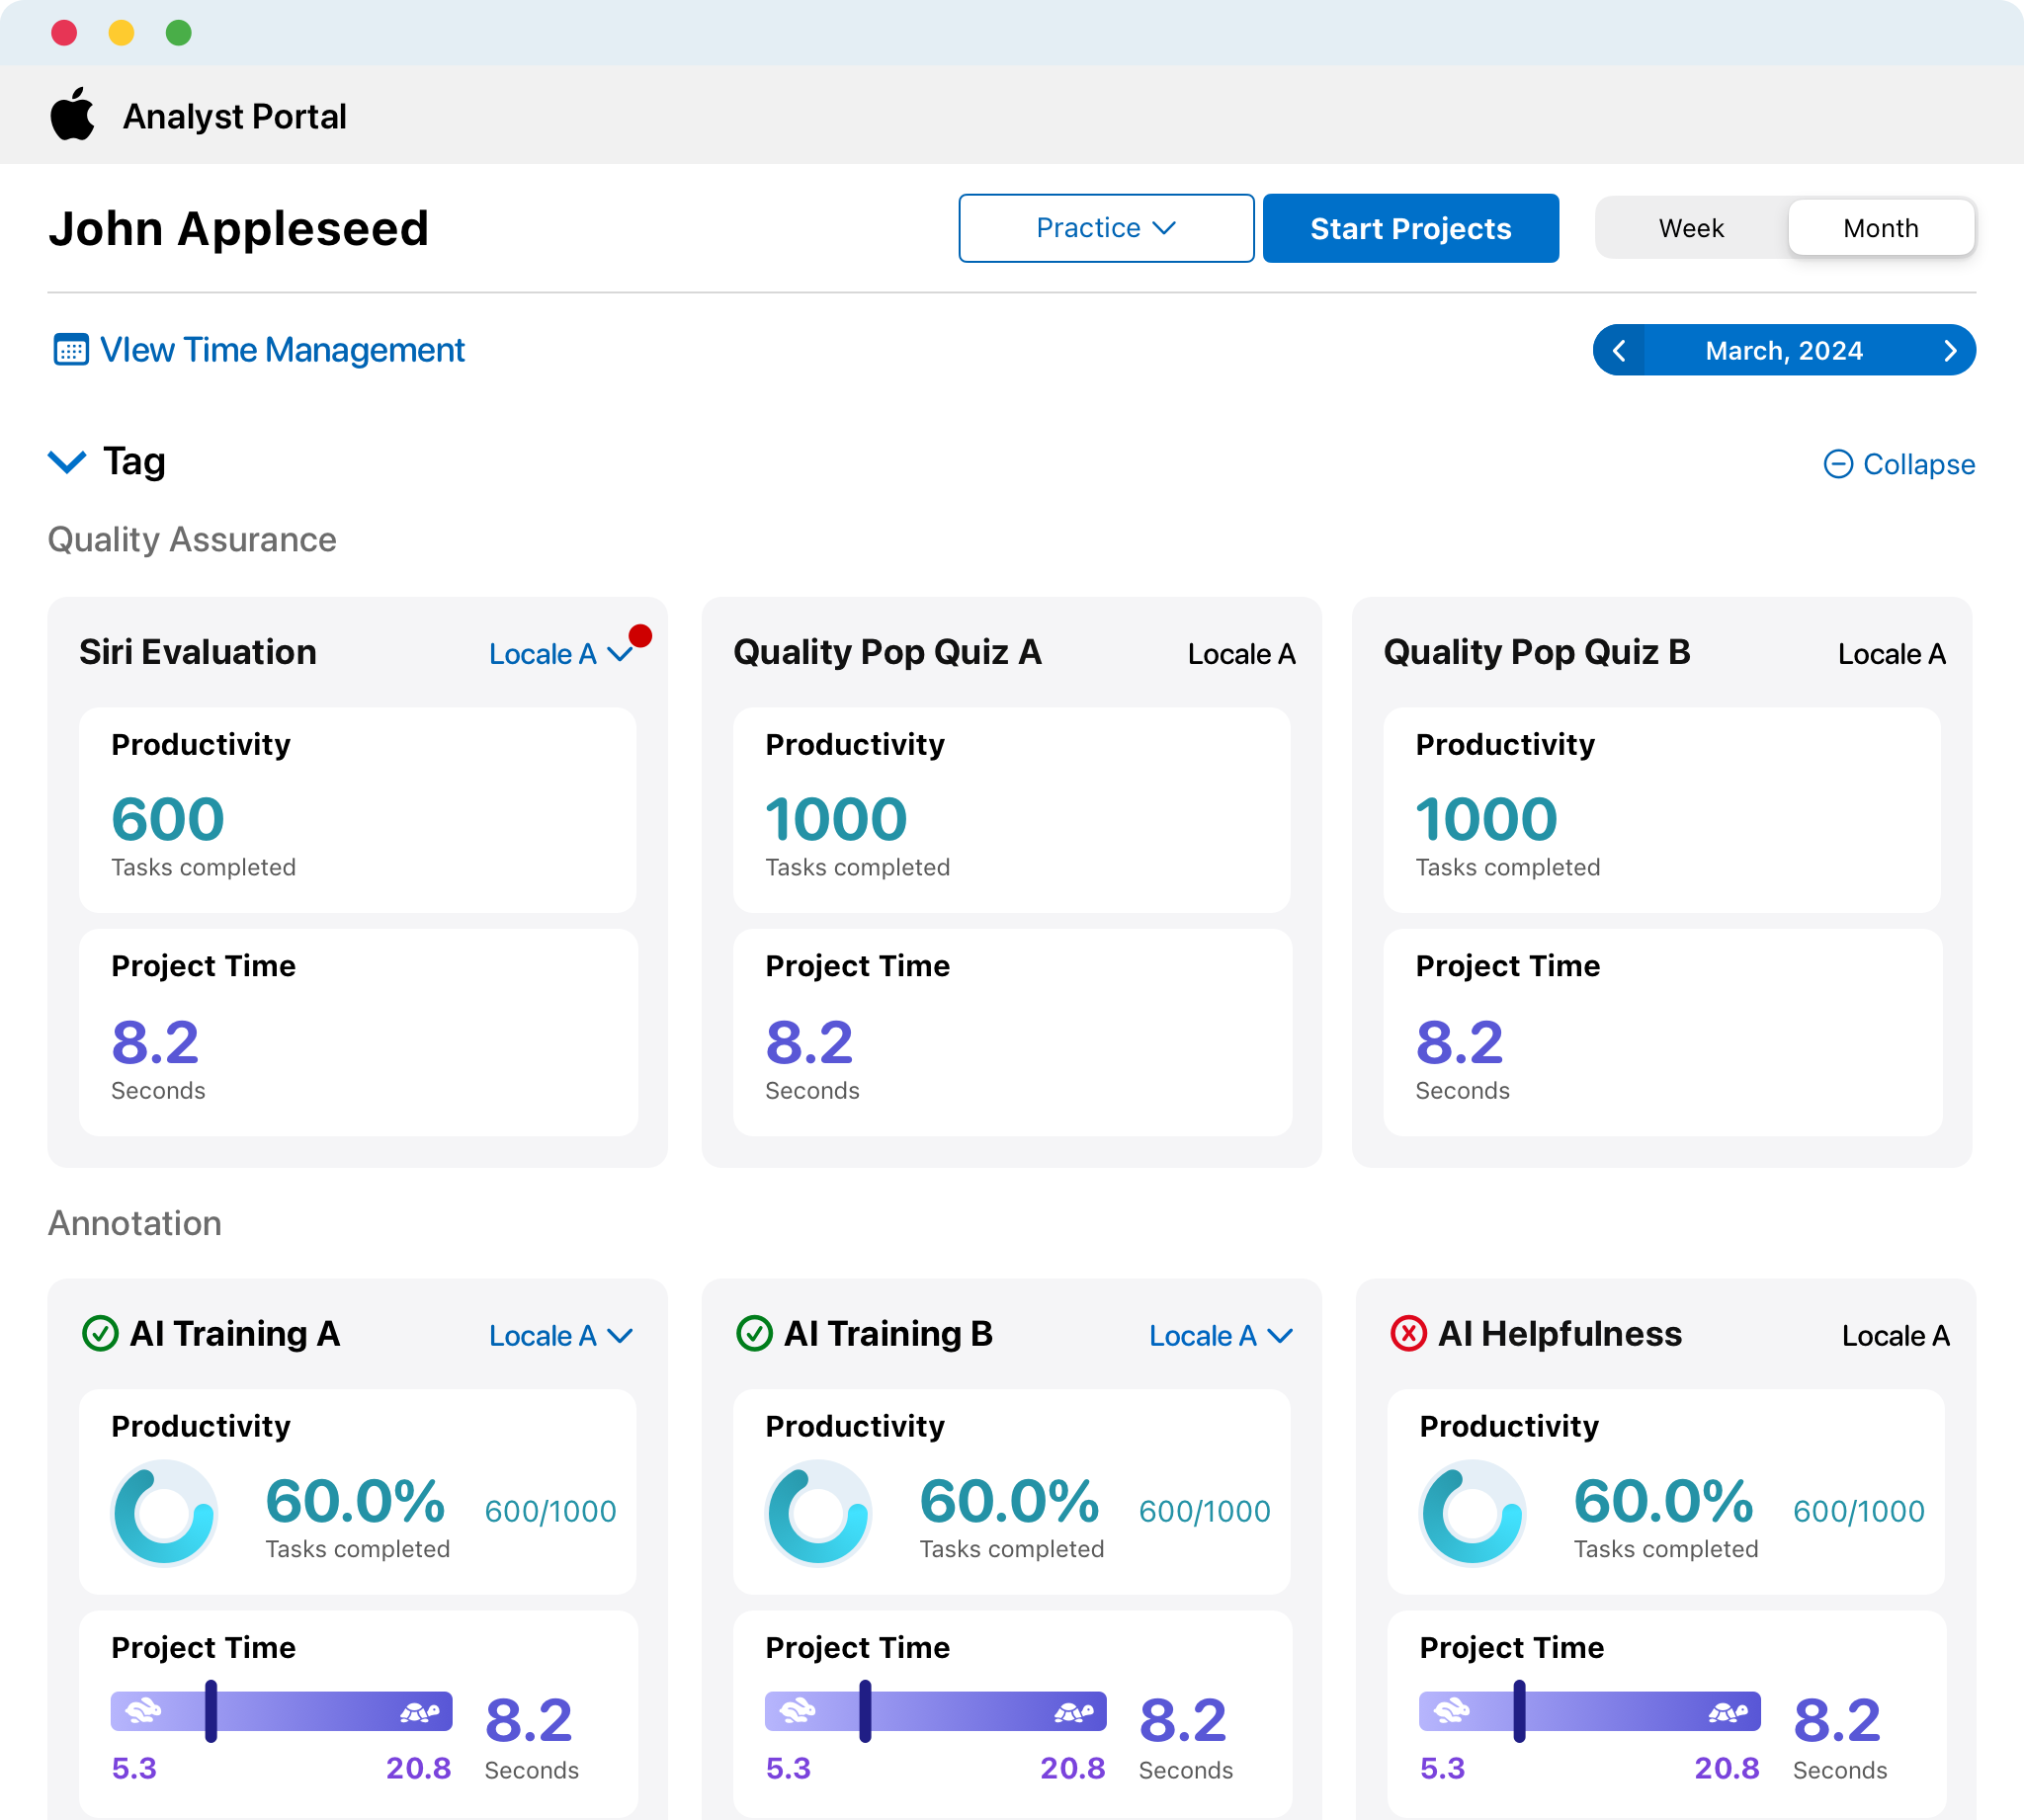
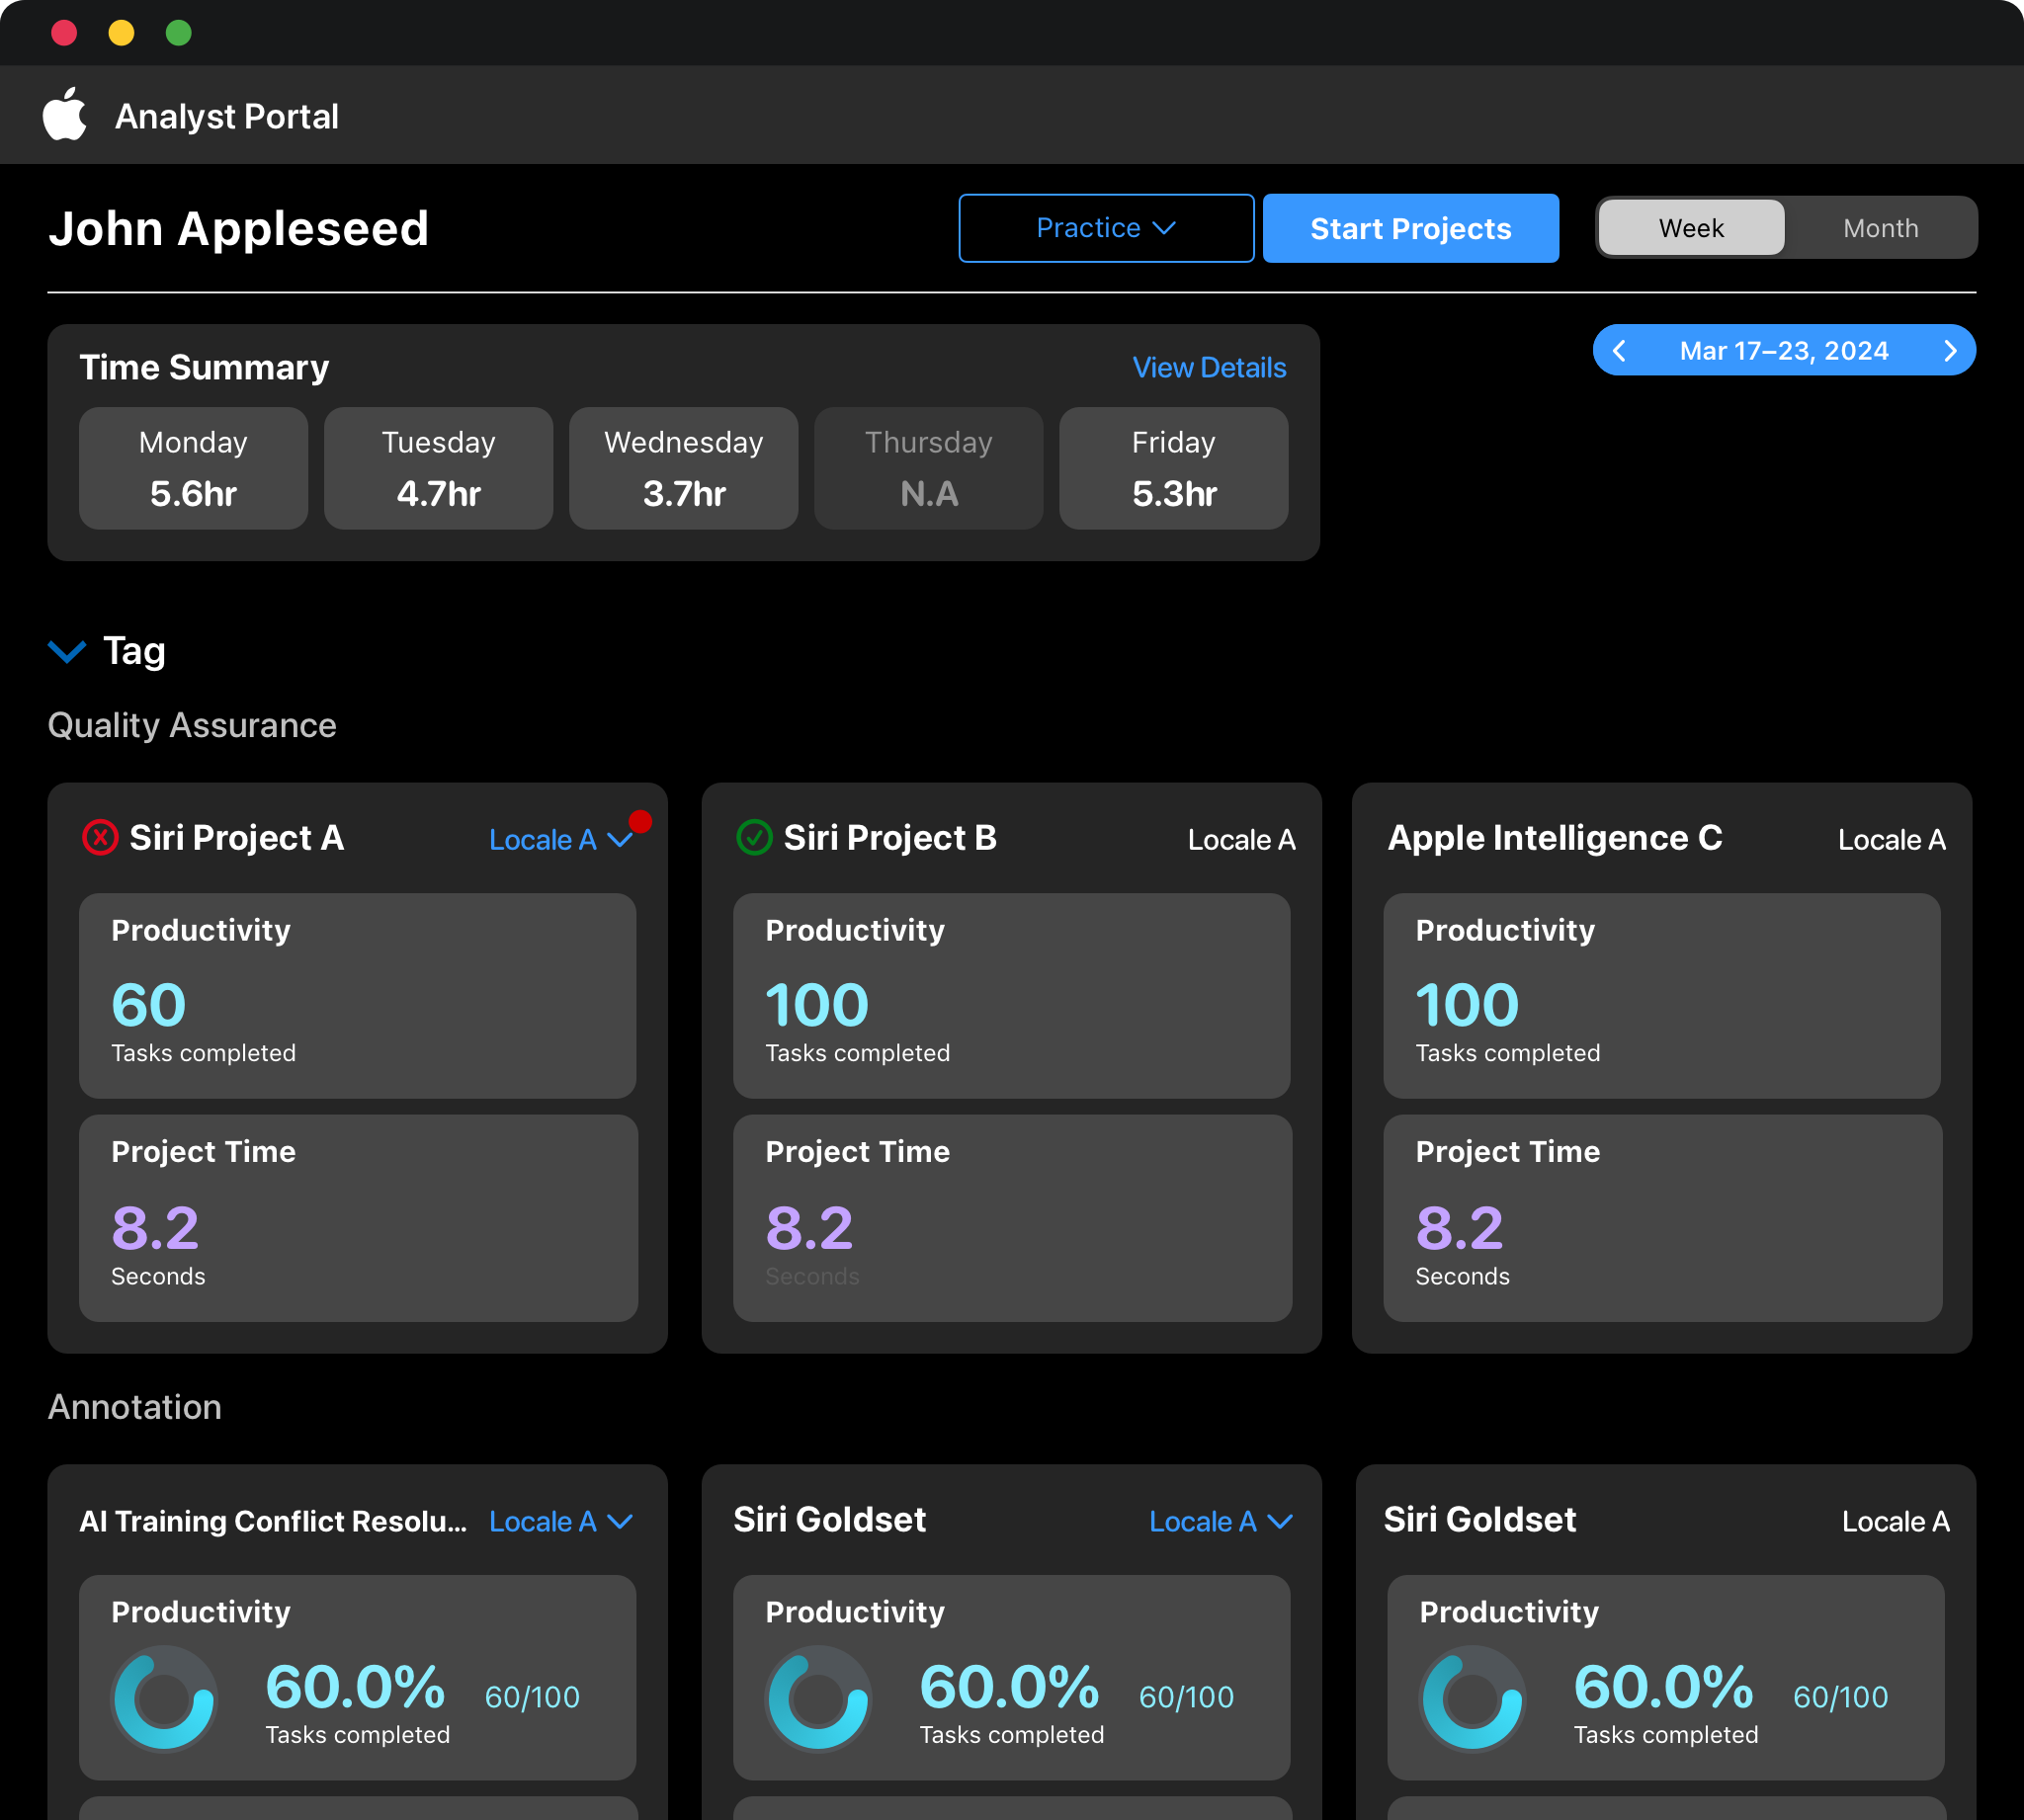
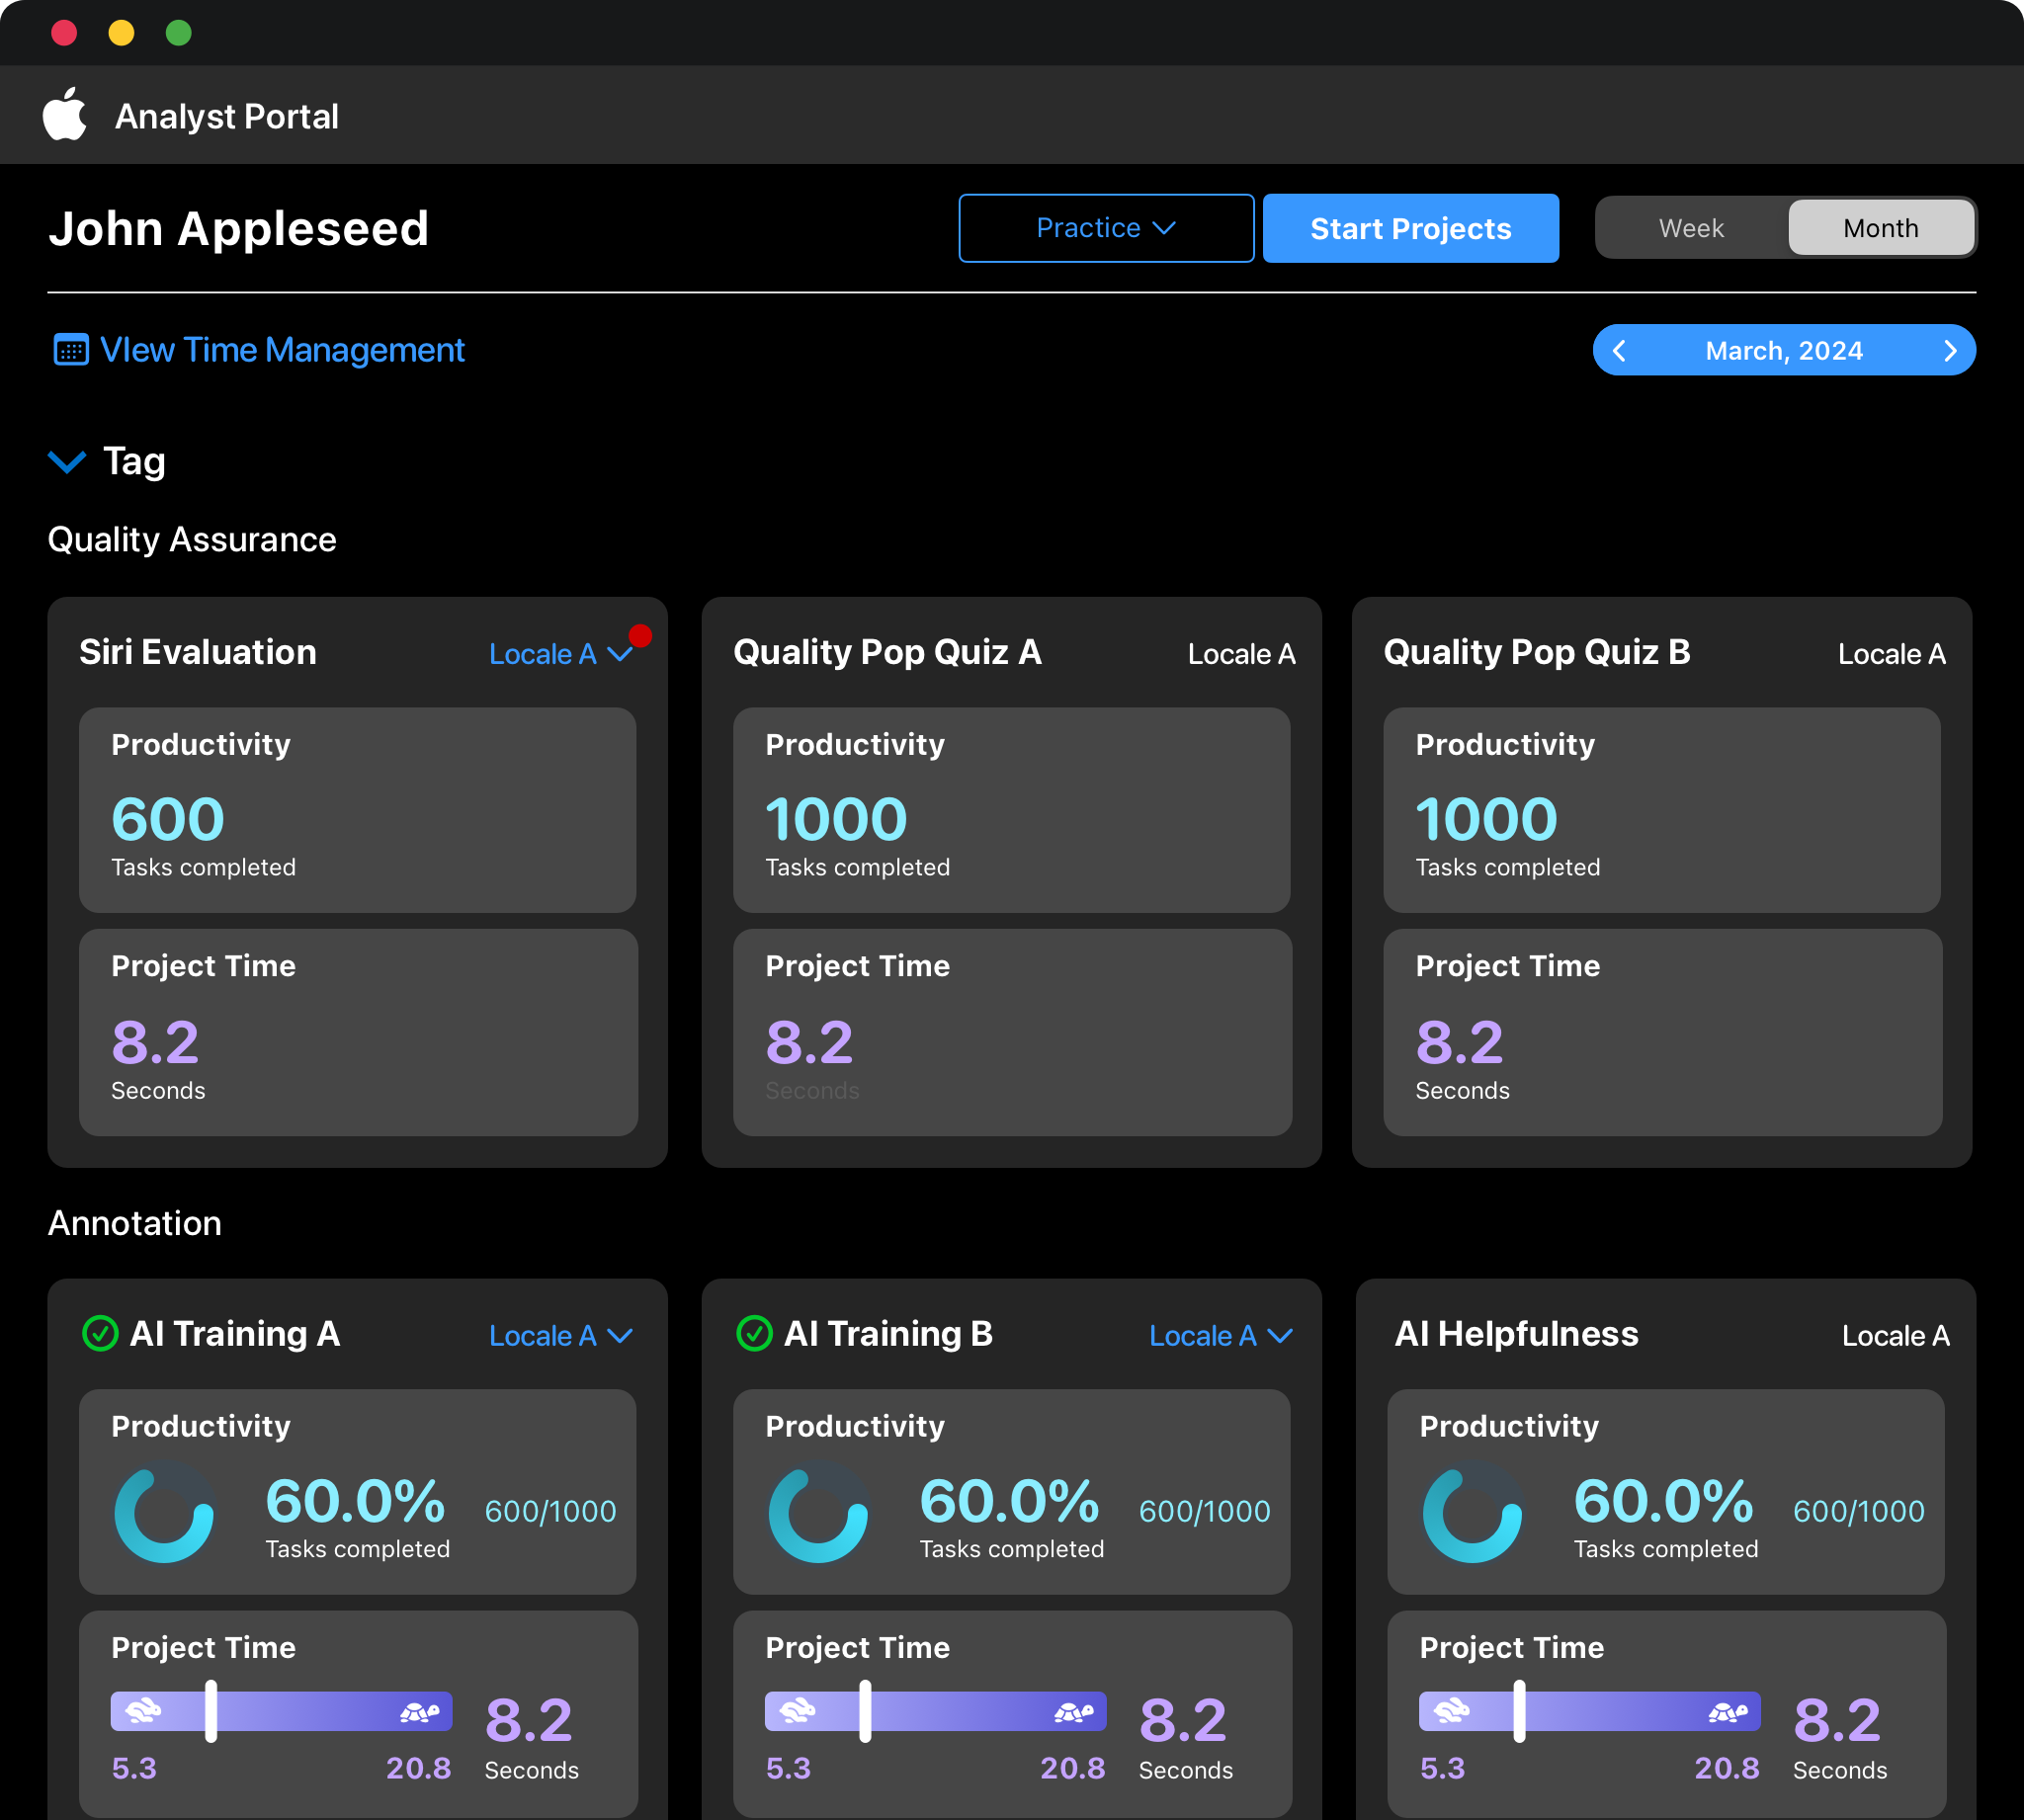
Reorganized metrics around individual projects instead of data type, aligning Data Science and Engineering on a structure Analysts could actually use.
Replaced static targets with a dynamic Productivity goal that updates as peer groups shift, winning Data Operations leadership over to a fairer standard.
Results
Significant Productivity Increase
Analyst productivity rose measurably after launch.
Balanced Quality & Productivity
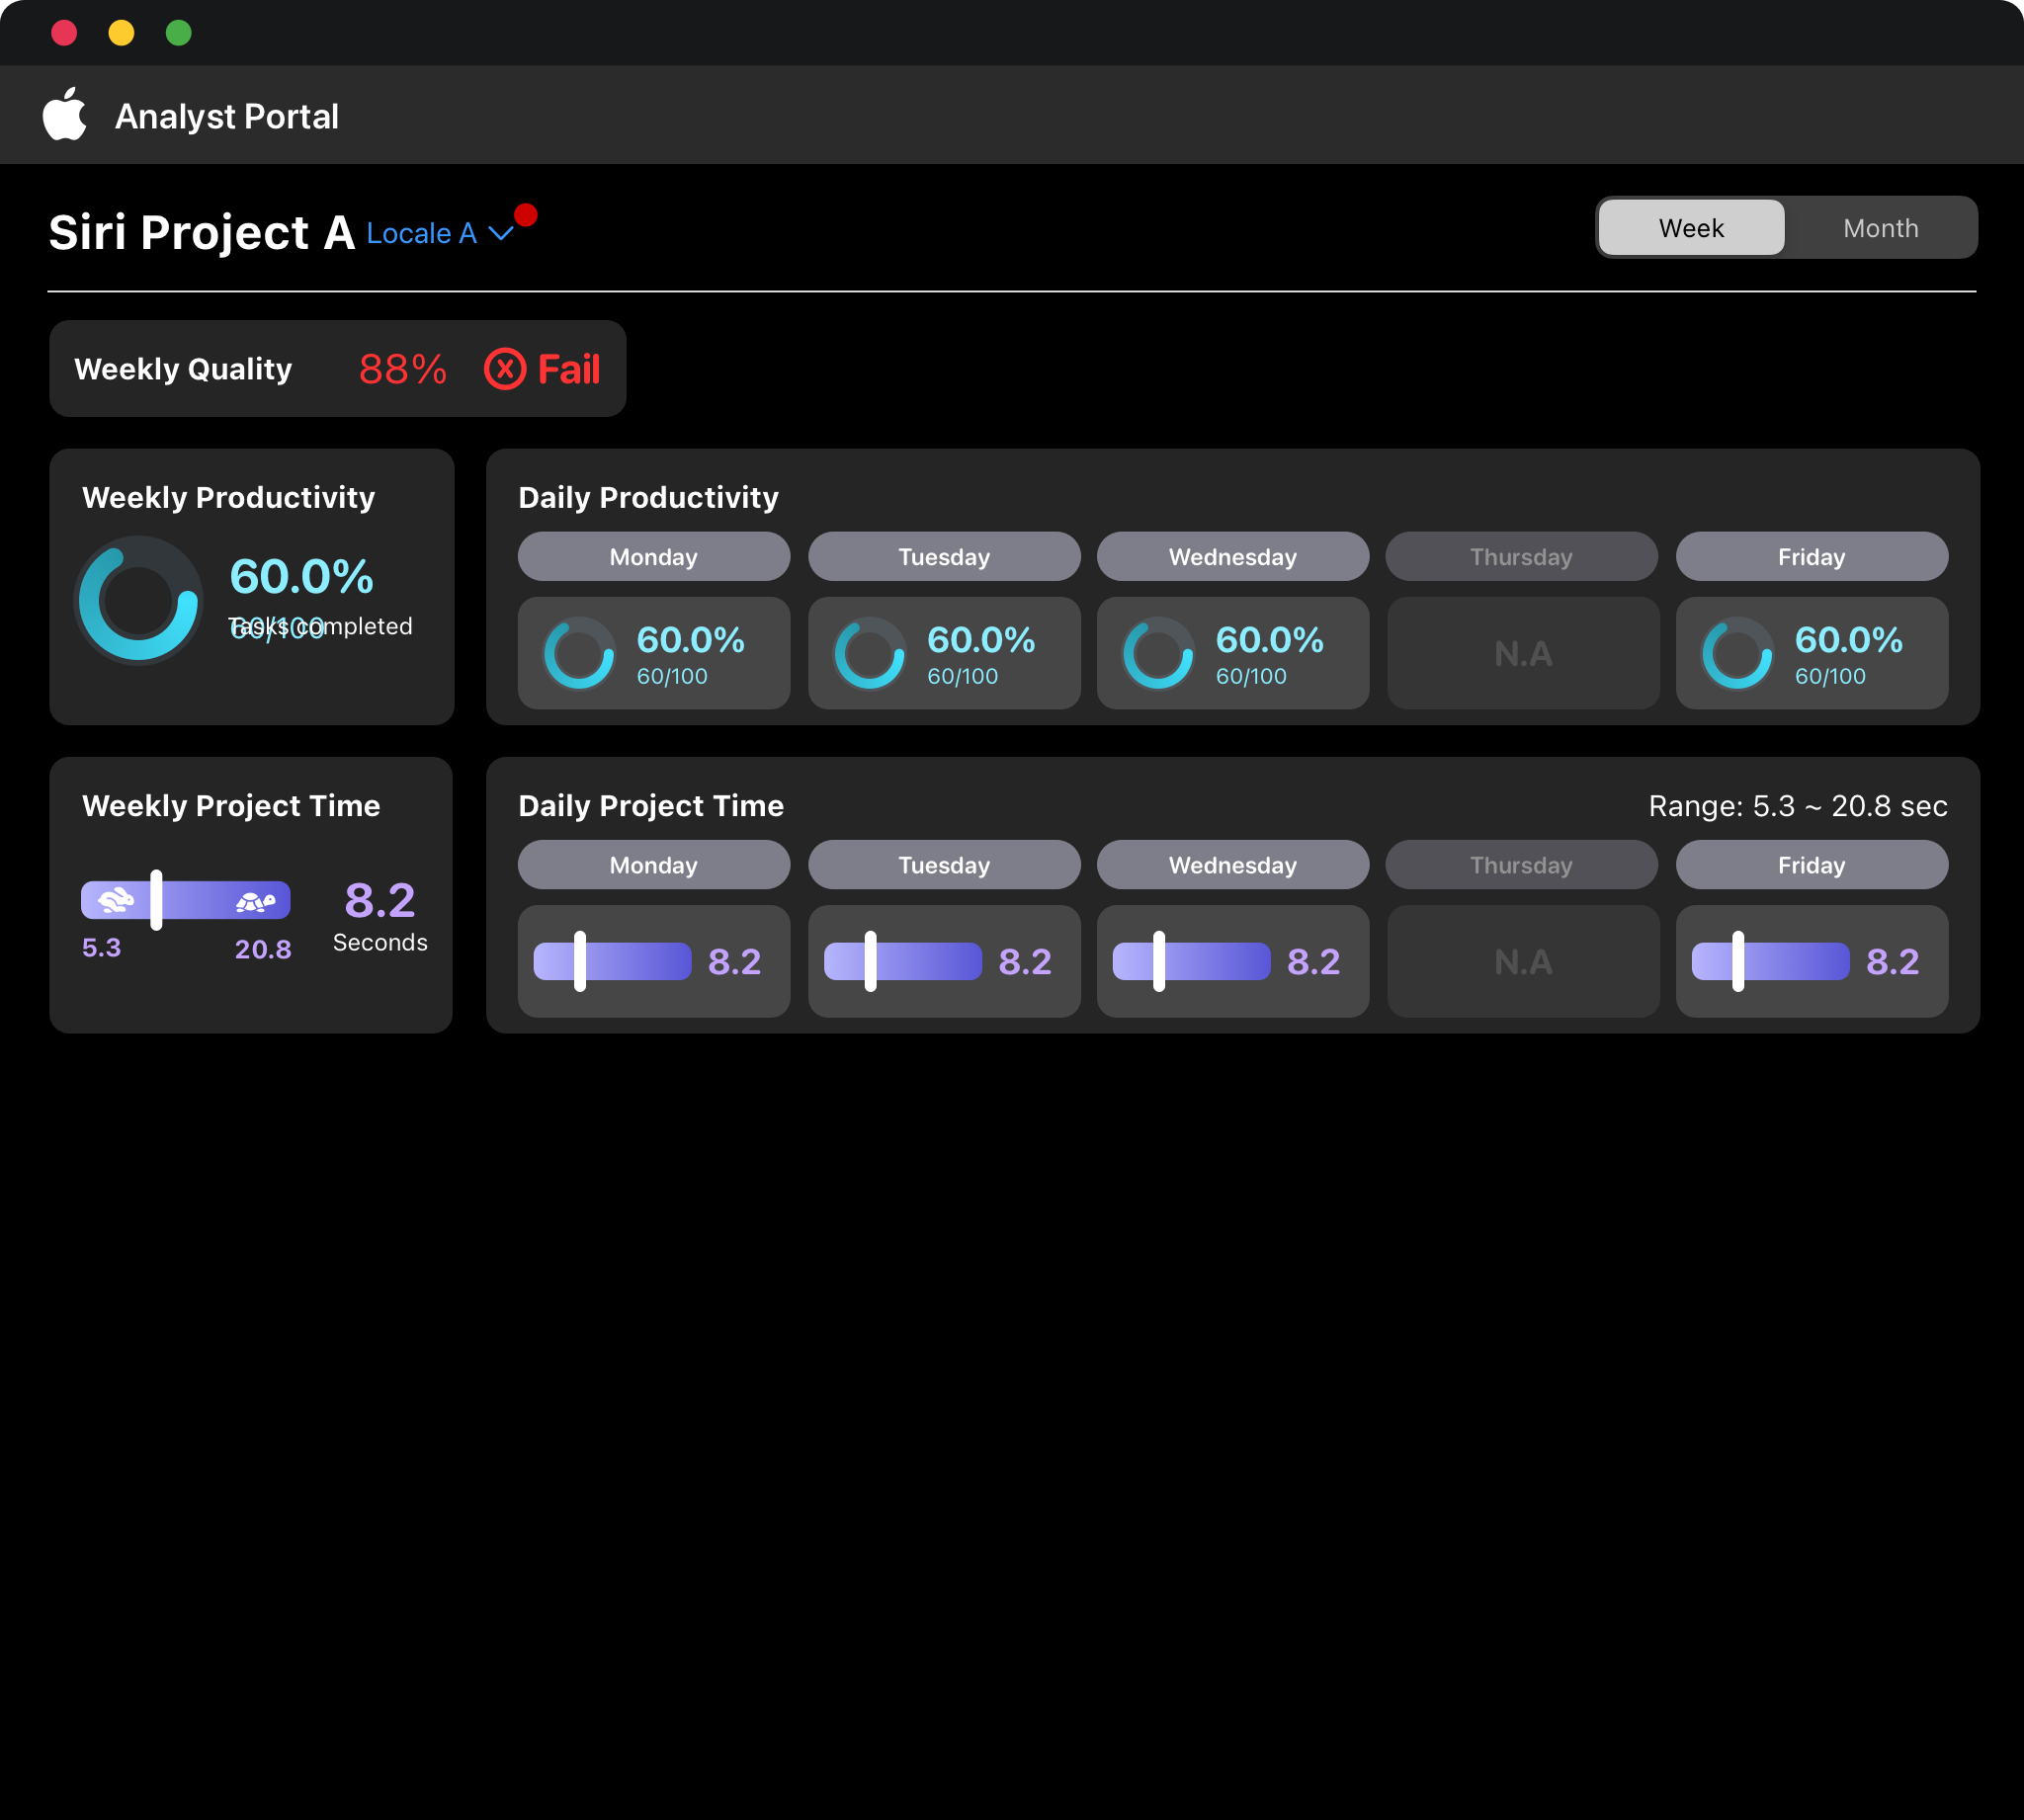
Replaced the numeric quality score with pass/fail, removing the 100% accuracy over-index.
Standardized Performance Management
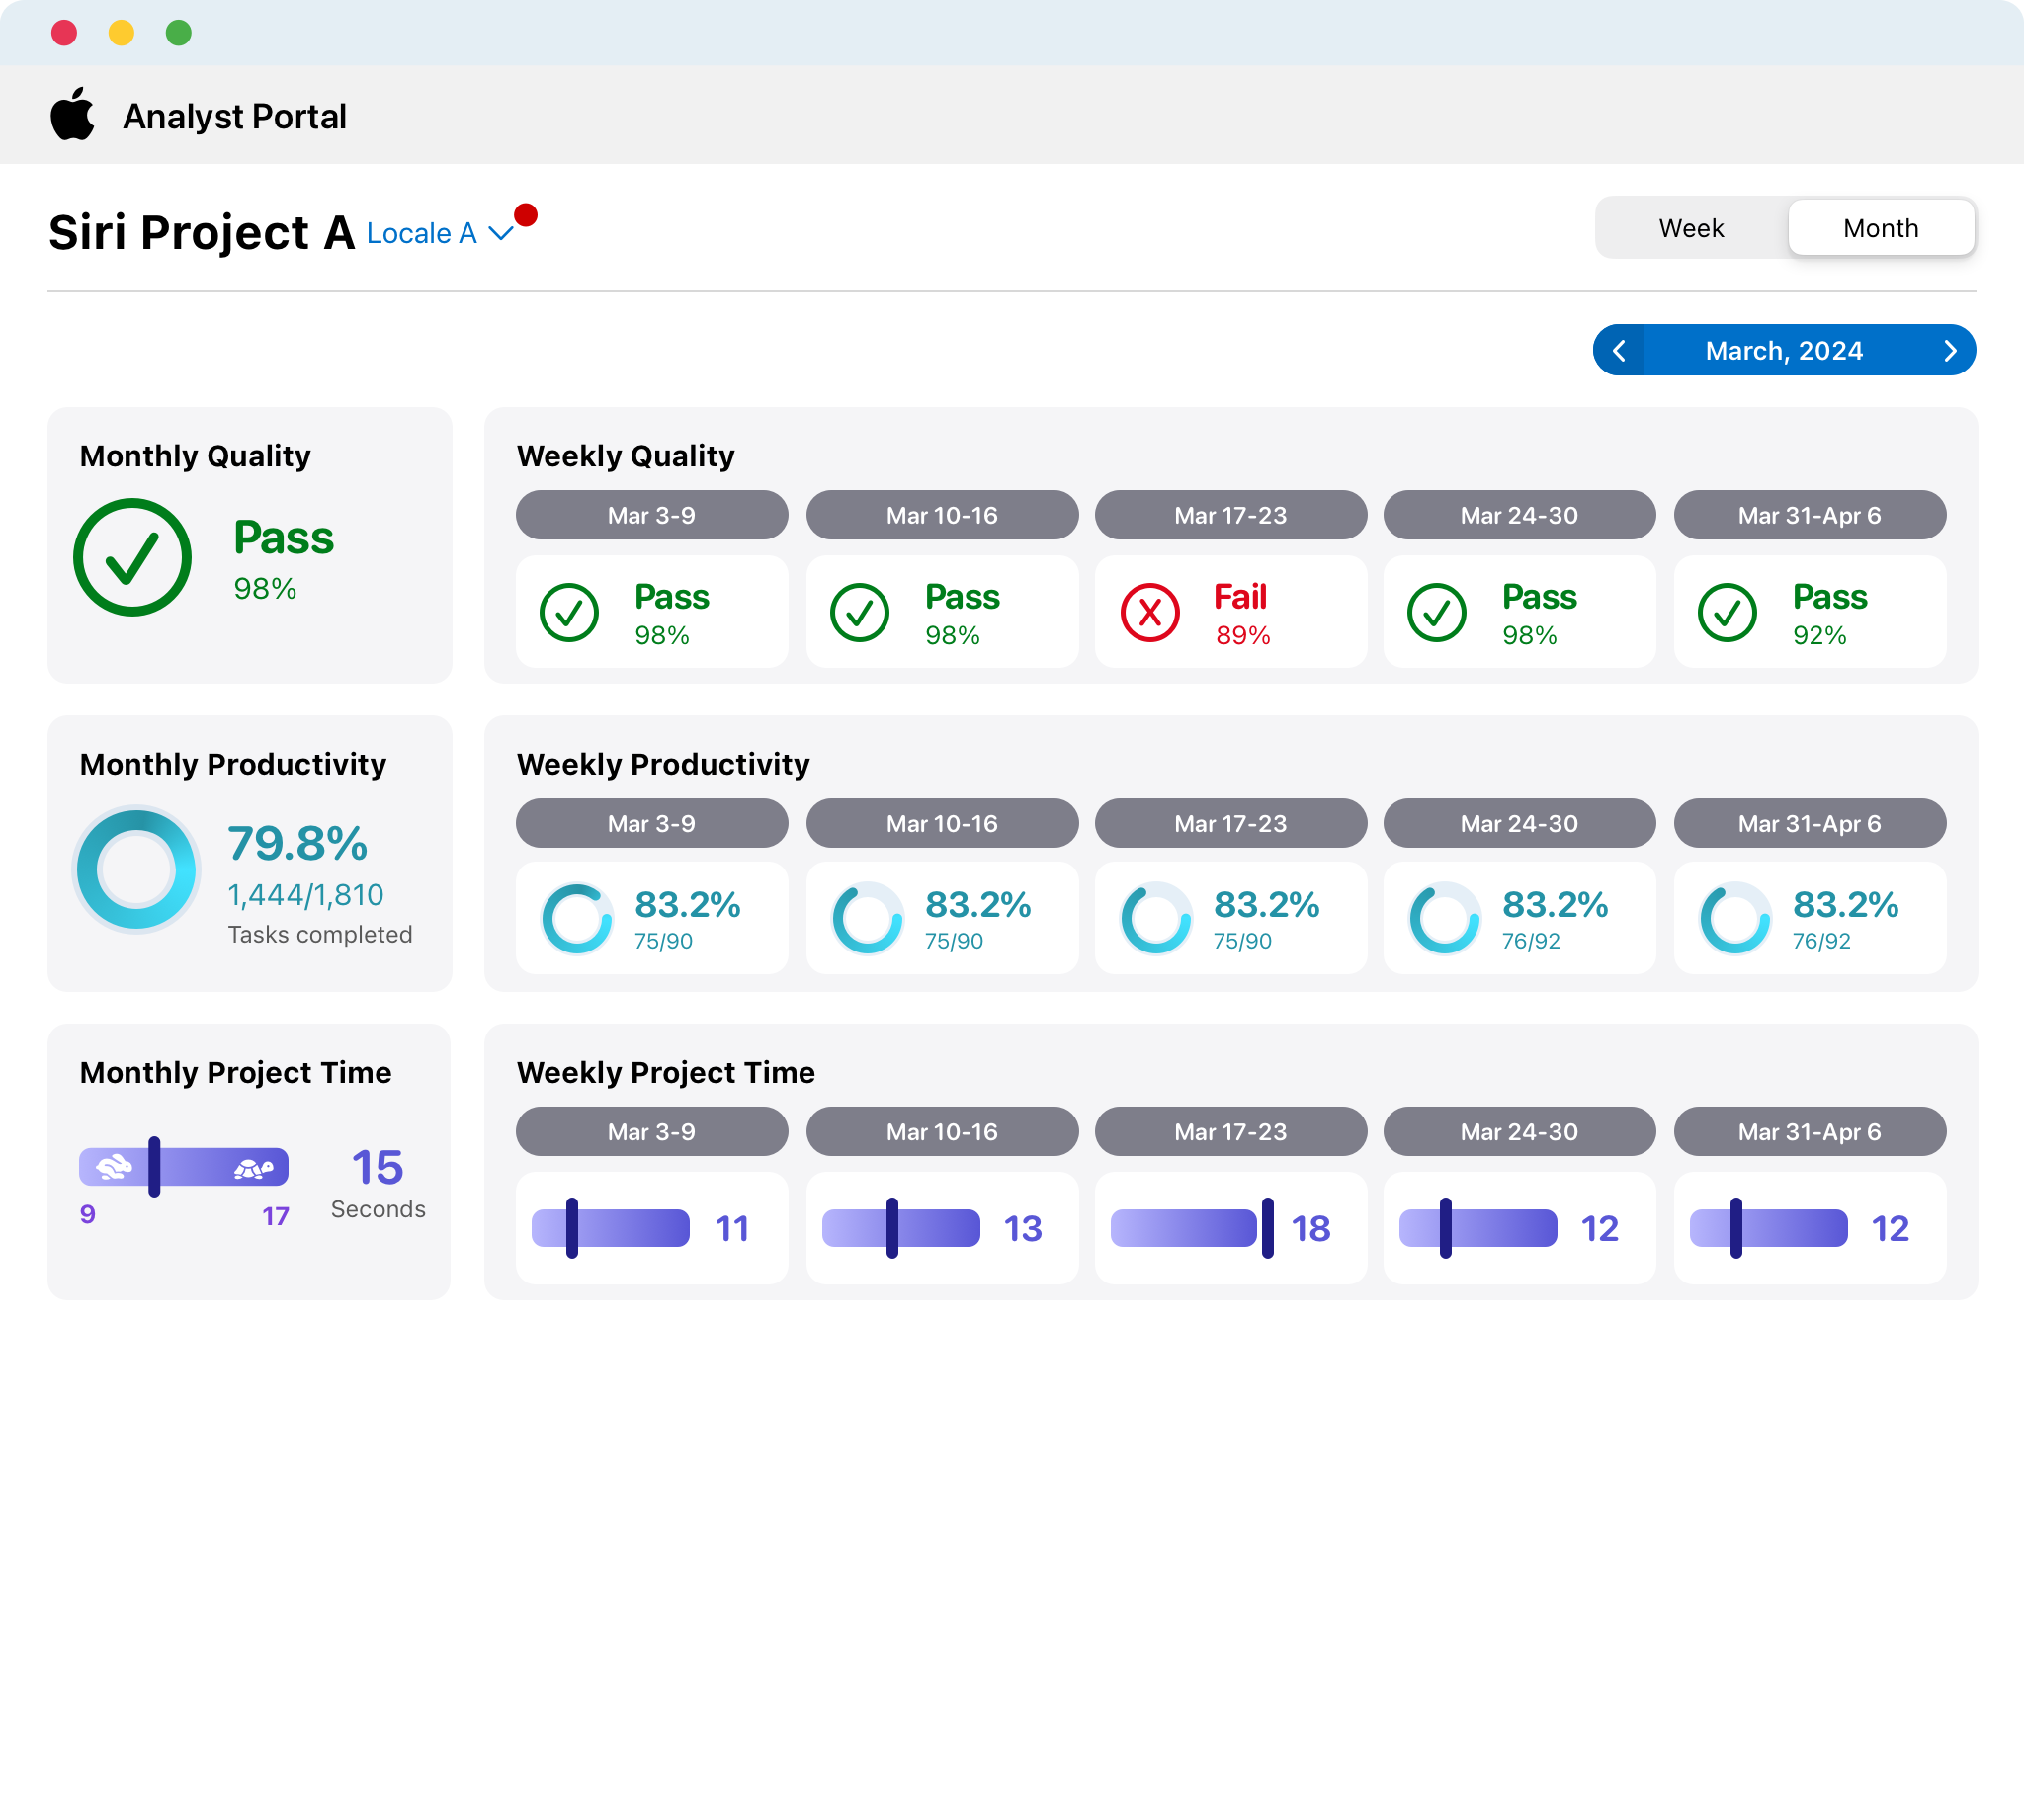
Grouped metrics by project, with weekly and monthly trend charts.
Eliminated Blind Spots
Shipped dynamic, peer-based Productivity targets driven by live data.
Analyst Portal 3.0 Final Design
Functional GenAI prototype coming soon. For now, switch weekly and monthly, click a project, and try the theme toggle.